|
|
||||||
|
|

August 25, 2008 Credit Risk Spreading Beyond Financials Just a note - the Annual Report of the Hussman Funds will be posted next week in lieu of the regular weekly comment, barring unusual market activity requiring immediate remarks. The Report includes details on fund performance, investment positions, as well as a detailed letter to shareholders. --- With both the markets and underlying conditions relatively unchanged in the past week, we continue to remain defensive, and alert to a more pointed degree than usual. The stock, bond and foreign exchange markets continue to trade essentially on the theme that the global economy is weakening, but that the U.S. has dodged a recession. This strikes me essentially as an artifact of lagging indicators such as the unemployment rate (on which the full force of the current economic downturn has yet to be felt) as well as various coincident indicators such as the ISM survey and capacity utilization, which are still hovering at tepid levels without clearly breaking down. I'll emphasize again that at the point we do observe sufficient evidence for investors to concede recession, the potential downside could be abrupt, leaving little opportunity to make defensive changes after the fact. As I've often said, the best time to panic is before everybody else does. Among the factors that concern me here is the continued widening of credit spreads, which increasingly suggests that default risk may be starting to spread beyond the financial sector into the broader economy. Meanwhile, there is a relative complacency in the stock market because investors are still convinced that the extreme "tail risk" in the markets has been removed by the Federal Reserve and the U.S. Treasury. We observe that complacency in the continued low level of option volatilities. Much of the value of options is in the small probability of very large moves. If you remove that tail risk, option premiums become much less expensive, and that's how options are trading at present. Unfortunately, implied volatilities tend not to be terribly good predictors of actual subsequent market volatility, so we can't take the low VIX as any sort of "collective intelligence" about market prospects. Typically, low volatilities are observed prior to poor market performance, with the worst performance often following a low VIX that breaks out moderately to the upside. For that reason, fluctuations in the VIX, particularly any move beyond 25-27, are worth watching here. Years ago, Larry Williams used to look for a situation he called the "Jaws of Death" - noting that when bond prices were weakening but stock prices were strengthening, the two differing trends opened a set of "jaws" that tended to snap shut, usually due to abrupt weakness in stocks. On that note, Bill Hester sent a chart over the weekend noting "I thought this was an interesting graph. The blue line is the 5-Yr Swap Spread, and the red line is the VIX. Credit investors are getting very nervous while equity investors are mostly whistling Dixie. It looks like a variation on the jaws of death that you've mentioned to me before...." Nothing like a good picture to complete the story (thanks Bill).
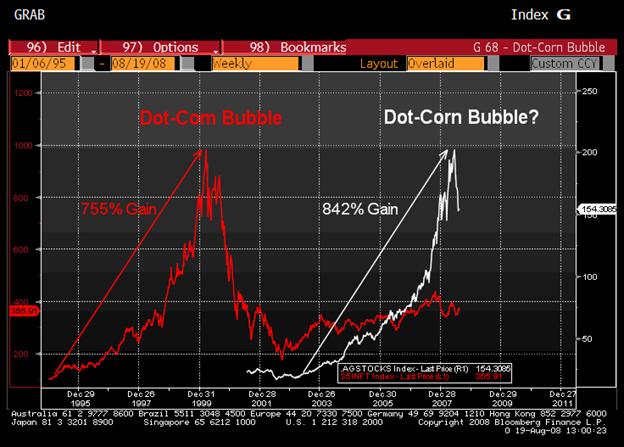
In short, the markets are presently trading on a theme that largely overlooks the potential (and in my view, the reality) of a significant U.S. recession. At the point of recognition, we may very well observe abrupt weakness in both stock prices and the U.S. dollar. Meanwhile, oil and precious metals prices continue to deteriorate (though we did get a brief spike last week which gave us a chance to clip off the precious metals positions we established on prior weakness). While the selloff in oil prices is viewed by some as a "stimulus" for the economy, this is a classic mistake of confusing shifts in a demand curve with movements along it. Put simply, oil prices are weakening because the global economy is weakening. That represents a shift in the demand curve. You do not then read the lower oil prices off of the graph and assert that the lower prices will lead to a stronger global economy. As for other commodities, the following chart from Bloomberg is instructive. It compares the 90's "dot-com" bubble with the performance of the "dot-corn" stocks - a capitalization weighted index of agricultural stocks (Monsanto, Potash, Agrium, Archer Daniels Midland, and Bunge). I continue to view commodities as being at risk for further price deterioration, even in the event that the U.S. dollar itself weakens. That's another way of saying that, from the perspective of other countries, commodities prices can be expected to decline by an even greater amount than the U.S. dollar.
Market Climate As of last week, the Market Climate in stocks remained characterized by unfavorable valuations, unfavorable market action, and generally hostile yield trends, holding the Strategic Growth Fund to a fully hedged stance. We continue to allocate about an additional 1% of assets in option premium to establish a "staggered strike" configuration, which provides a somewhat stronger buffer against market weakness. In bonds, the Market Climate was characterized last week by relatively neutral yield levels and modestly unfavorable yield pressures. The Strategic Total Return continues to carry a relatively low duration of about 2.5 years (meaning that a 100 basis point move in interest rates would be expected to impact the Fund by about 2.5% on the basis of bond price fluctuations). As I suggested last week, a brief but powerful spike in precious metals shares allowed us to eliminate the bulk of the exposure to precious metals shares that we had established on prior weakness. The Fund currently has only about 1% of assets in precious metals shares, and we are gradually using periodic strength in the U.S. dollar to boost our foreign currency positions toward 20% of assets. --- The foregoing comments represent the general investment analysis and economic views of the Advisor, and are provided solely for the purpose of information, instruction and discourse. Prospectuses for the Hussman Strategic Growth Fund, the Hussman Strategic Total Return Fund, the Hussman Strategic International Fund, and the Hussman Strategic Dividend Value Fund, as well as Fund reports and other information, are available by clicking "The Funds" menu button from any page of this website. |
|||||||||||||||||||||||||
|
For more information about investing in the Hussman Funds, please call us at
1-800-HUSSMAN (1-800-487-7626) 513-326-3551 outside the United States Site and site contents © copyright Hussman Funds. Brief quotations including attribution and a direct link to this site (www.hussmanfunds.com) are authorized. All other rights reserved and actively enforced. Extensive or unattributed reproduction of text or research findings are violations of copyright law. Site design by 1WebsiteDesigners. |