|
|
||||||
|
|

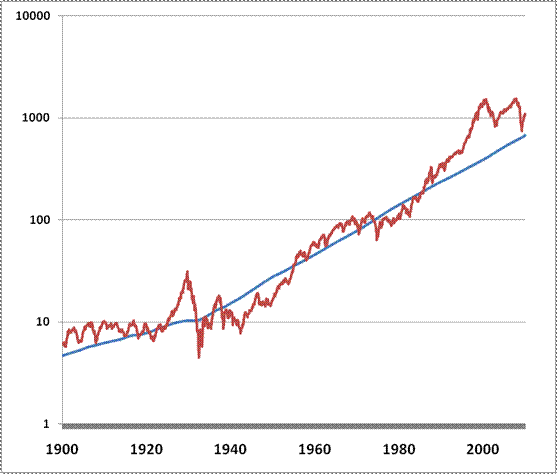
December 14, 2009 Decidedly Speculative As of last week, the S&P 500 nearly matched the richest valuations, on normalized earnings, ever observed prior to 1995. While it is quite true that valuations have been higher for the majority of the period since the late 1990's, it is equally true that the total return of the S&P 500 over that period has been dismal. Undeniably, stocks are still "cheap" compared to the record overvaluations of 2000 and 2007. In order buy stocks on that basis, investors must accept the prospect of unsatisfactory long-term returns in any event, but they are free to speculate as long as they are willing to treat 2000 and 2007 as normal, and to rely on the market pressing to even greater overvaluation in order to achieve satisfactory near-term returns. It is also true, however, that market valuations since 1995 have been distinct outliers from a historical perspective (as are the disappointing overall returns). That does not imply that near-term returns must be negative. While we continue to observe weak sponsorship from a volume perspective, flattening momentum, increasing non-confirmations, and some early pressures in yields and credit spreads, we have not observed sharp internal deteriorations at this point. As a result, it is unclear whether or not investors will continue to speculate for a while. Even so, it is already evident that the longer-term outcome of risk-taking here will almost undoubtedly be unrewarding. In short, any virtue of stocks here is decidedly speculative. Stocks are overvalued to a level from which uninspiring returns have always followed. That fact is true regardless of whether or not the economy is in a sustainable recovery. The S&P 500 is currently priced to deliver total returns averaging about 6.1% annually over the coming decade, even assuming that the future trajectory of S&P 500 earnings continues to obey the long-term peak-to-peak growth channel that has characterized earnings for most of the past century. Notably, that 6.1% annual projected return was equaled at the market peaks of the 1960's, early 1970's and at the 1987 peak. Lower prospective 10-year returns were only observed during the late 1990's, which have been followed, not surprisingly, by 10-year returns lower than 6.1% annually. When stocks are overvalued, one does not get to have his cake and eat it too, without getting indigestion later. We generally present valuations from the standpoint of earnings, applying a wide range of historically consistent terminal P/E multiples to mid-channel earnings 10 years hence, projected using the very well behaved historical growth channel for S&P 500 earnings across economic cycles. Of course, we can also analyze valuations from the standpoint of the discounted cash flows that are likely to be delivered to investors over time. These include our variant of the Barsky-DeLong model (presented in Don't Discount Discounted Dividends, and the realized payout model that I presented in The S&P 500 as a Stream of Payments. The following charts update where valuations stand from a discounted payout perspective. The Barsky-DeLong model is the most charitable and optimistic. That approach assumes that stocks have gradually become less risky as the economy has developed, and therefore deserve higher valuations over time. Thus, although stocks were priced to deliver a real, after-inflation return of 7% annually early in the century, the Barsky-DeLong model would currently be happy with long-term real returns of just 4.2% annually. Of course, lower required returns imply higher equilibrium valuations. On the basis of that 4.2% annual real return target, the appropriate index level for the S&P 500 would currently be about 810. Again, this is the most charitable model. The red line below tracks the actual S&P 500 index. The blue line is our version of Barsky-DeLong. Given that current index levels are well above those implied by the model, the conclusion is not that stocks must decline immediately, but rather, that long-term total returns for the S&P 500 are likely to be less than 4.2% after inflation. 
Alternatively, on the assumption that future growth rates match what we've observed over the past two decades and indeed over most of the past century, an expected long-term total return of 10% for the S&P 500 (what investors generally carry in their heads as the "typical" long-term return on stocks) would currently be consistent with an index level of 672. Again, the above result doesn't mean that stocks must actually drop to 672. It just means that at current levels, the prospective long-term return on stocks is nowhere near 10% annually. It also means that if stocks are eventually priced to deliver a long-term return of 10%, say, a decade from now, the total return on the S&P 500 between now and then would average roughly [ 1.10 * (672/1106)^(1/10) - 1 = ] 4.65% annually. So one can choose from a variety of historically credible and long-term reliable valuation methods - cyclically adjusted earnings, nominal dividends, real dividends, q ratio, and so on - and one obtains largely the same result. Good valuation models may disagree moderately on the extent to which stocks are overvalued, but they do not disagree on the fact. "Second wave" concerns begin to appear As part of our ongoing attention to what I've called "second wave" credit risks, we're just beginning to hear concerns about fresh credit problems, foreclosures and loan losses from other corners. A few of these concerns are from particularly credible voices, which makes us feel, well, slightly less alone in our analysis. Last week, RealtyTrac reported that November foreclosure filings declined modestly from their peak in July. RealtyTrac SVP Richard Sharga appeared on Bloomberg and CNBC to discuss the numbers, saying "I'm afraid we might be looking at a false-positive trend right now. We haven't seen any improvement in underlying conditions. We're still looking at high levels of unemployment, we're still looking at a high percentage of mortgages being underwater, and we're still looking at limited credit availability which makes getting a loan difficult. So there's no organic reason for these numbers to be going down and what we think what's going on are some process delays and government intervention that is artificially delaying things. "I think that first quarter of next year we'll see a new wave of foreclosure activity. Delinquencies have been going up - we have five and a half million homeowners who are late on their mortgage payments right now, and many of those, under normal circumstances, would have already been in foreclosure. But the Treasury is asking lenders to make doubly sure that anybody who qualifies for the HAMP program or other modification program gets in those programs. We think we'll probably hit the historic peak next year, in 2010, as a lot of the Option-ARM loans reset, as unemployment related foreclosures peak, before numbers finally start to settle down a little bit in 2011. We're expecting the first quarter to be pretty ugly." Striking a similar chord, on Tuesday, Meredith Whitney appeared as the guest host on CNBC's Squawk Box. Whitney was one of the few Wall Street analysts who foresaw the recent credit crisis, and also anticipated what I've called the "March-November 2009 lull" in credit difficulties. Having been generally positive on the financials since the first quarter, she recently became quite negative. At the end of the broadcast, when asked to end on just one short, positive note, she replied, "The Blind Side was an amazing movie." Whitney noted, "In the second quarter, you had banks recapitalizing themselves with huge equity volumes, you had a lot of write-ups throughout the year, but the core loan books have been declining dramatically, so what's left? The toxic assets have all been written up. There's a very limited cash market for them. You would never know about the degradation in asset quality (of loans backed by Fannie Mae) because the government has been buying the paper. The paper has never traded higher. There's still time (for toxic assets to become a major problem again). They have to because there are not cash flows to support the payments on those bonds, and the bonds will break covenants. What's happening is that the banks are going to have to start selling stuff, and so you'll start seeing a yard sale to raise capital." One of the main concerns Whitney expressed was the collapse in credit availability. "In the last cycle in the early 1990's, the economy slowed and banks stopped lending but the securitization market was really getting started, so consumers actually had more liquidity. Now, consumers and businesses are being stuck by - banks aren't lending and there's no securitization. So you haven't had this amount of credit contraction. There has been a trillion and a half of credit taken away from credit card lines, and that is accelerating with all the regulatory changes. So the numbers just aren't big enough from a government standpoint to mitigate the decline in credit, which is ultimately going to influence behavior. The component parts do not add up. You cannot get to a robust economic recovery with so many states under duress." Looking forward to next year, Whitney warned of a 2010 outlook "which is so disturbing on so many levels to have so many Americans be kicked out of the financial system, and the consequence both political and economic of that is a real issue - you can't get around. It's never happened before in this country or in the modern economy. The biggest trend in 2010 will be seeing who gets kicked out of the banking system." Meanwhile, in January, new accounting rules will kick in which will force banks to move off-balance-sheet "structured investment vehicles," "trust preferred assets" and other beasts onto their balance sheet, which is expected to result in some sharp hits to bank capital. In response, regulators such as the FDIC will most probably be called upon to look the other way for a while. Floyd Norris of the New York Times refers to these off-balance-sheet assets as "a black hole that regulatory rules had ignored in assessing how much capital the banks needed to hold. The beauty of those securities was that they were really debt that the holding companies could call capital. Having that "capital" meant the bank could take on more debt. A system that lets a bank borrow more money because it has already borrowed money - rather than because it has sold stock - is hardly a wise one." Market Climate As of last week, the Market Climate for stocks was characterized by unfavorable valuations and mixed market action. As noted above, price-volume sponsorship remains tepid, momentum is flattening, and we've got some early non-confirmations and yield pressures. Stocks are also clearly overbought on an intermediate-term basis, and investment advisory sentiment is down to a bearish percentage of just 16.5%. Still, we don't observe a clear breakdown in market internals yet, so there is some remaining prospect for further speculation. The Strategic Growth Fund continues to vary its exposure to market risk in a narrow range, moving to a modestly constructive stance in response to market weakness (with a market sensitivity in the range of 10-15% of assets, but with index put options against nearly the entire portfolio in any event), and clipping back our exposure to a more defensive position on market strength. In bonds, we've observed some upward yield pressures on long-term Treasuries recently, largely in response to enthusiasm about November's nearly flat employment report. While we would be inclined to add to our portfolio duration modestly on a further increase in yields - particularly given the prospects for fresh credit difficulties - the recent upward push in yields is not quite enough to prompt such a shift. In the Strategic Total Return Fund, we continue to carry a duration of only about 3 years, which remains fairly conservative, with about 2% of assets in foreign currencies, about 2% in precious metals shares, and about 4% of assets in utility shares. --- The foregoing comments represent the general investment analysis and economic views of the Advisor, and are provided solely for the purpose of information, instruction and discourse. Prospectuses for the Hussman Strategic Growth Fund, the Hussman Strategic Total Return Fund, the Hussman Strategic International Fund, and the Hussman Strategic Dividend Value Fund, as well as Fund reports and other information, are available by clicking "The Funds" menu button from any page of this website. |
|||||||||||||||||||||||||
|
For more information about investing in the Hussman Funds, please call us at
1-800-HUSSMAN (1-800-487-7626) 513-326-3551 outside the United States Site and site contents © copyright Hussman Funds. Brief quotations including attribution and a direct link to this site (www.hussmanfunds.com) are authorized. All other rights reserved and actively enforced. Extensive or unattributed reproduction of text or research findings are violations of copyright law. Site design by 1WebsiteDesigners. |