|
|
||||||
|
|

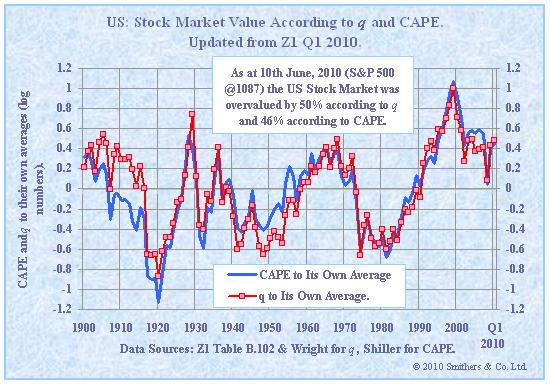
July 19, 2010 Don't Take the Bait Breaking News: Philly Fed Survey at 5.1, Showing that Growth Is Firming at a Slower Pace This was an item that appeared on CNBC MobileWeb on Thursday. Read that headline again. Growth is firming. At a slower pace. Talk about "spin." You can't make this stuff up. Important metrics of economic activity are slowing rapidly. Notably, the ECRI weekly leading index slipped last week to a growth rate of -9.8%. While the index itself was reported as unchanged, this was because of a downward revision to the prior week's reading to 120.6 from the originally reported 121.5. The previous week's WLI growth rate was revised to -9.1% from the originally reported -8.3% rate. Meanwhile, the Philadelphia Fed Survey dropped to 5.1 from 8.0 in June, while the Empire State Manufacturing Index slipped to 5.1 from 20.1. The Conference Board reported that spending plans for autos, homes, and major appliances within the next six months all dropped sharply. These figures are now at or below the worst levels of the recent economic downturn, and are two standard deviations below their respective norms - something you don't observe during economic expansions. As I've frequently noted, the first year of post-war economic recoveries are invariably paced by strong growth in credit-sensitive spending such as housing, autos, appliances and capital goods. While government programs such as Cash-for-Clunkers and the first-time homebuyers' credit did bring forward a great deal of demand to produce short spikes in activity, we continue to observe a failure of the private economy to pick up where government spending now trails off. There was a bit of good news last week in that new claims for unemployment (seasonally adjusted) dropped by 29,000 to 429,000. Still, much of this decline can be attributed to the fact that several manufacturers, including General Motors, skipped their usual summer layoffs. While the seasonal adjustment factors are smaller for the weekly claims data than they are for the monthly employment data (see Notes on a Difficult Employment Outlook - February 22, 2010), it's clear that last week's figure benefited from a downward seasonal adjustment factor applied to data that did not require it. As usual, the 4-week moving average, at 455,250, is more informative. Incrementing the latest week's data by about 20,000 to reflect the excessive seasonal factor would imply a 4-week average of roughly 460,000, fairly consistent with the other data we're observing. Given the likelihood of heavy job cuts at the state and local levels in the next few quarters, these figures are at odds with the notion that the economy is in a durable recovery. Economic Policy Notes The U.S. economy continues to face the predictable effects of credit obligations that quite simply exceed the cash flows available to service them, coupled with the predictable shift away from the consumption patterns that produced these obligations. The misguided response of our policy makers has been to defend bondholders at all costs, using public funds to make sure that lenders get 100 cents on the dollar, plus interest, while at the same time desperately trying to prod consumers back to their former patterns of overconsumption. These policies are designed to preserve exactly the reckless and unsustainable behavior that caused the recent downturn. They are likely to fail because the strategy is absurd. The ultimate outcome, which will be forced upon us eventually if we do not pursue it deliberately, will be the eventual restructuring of debt obligations and a gradual shift in the profile of U.S. economic activity toward greater saving - either to finance exploding government deficits, or preferably, to finance an expansion in productive investment, research and development, and capital accumulation. From my perspective, bolder approaches are required. Debt that cannot be serviced should be restructured, rather than socializing the losses of reckless private decision-making. We will inevitably have a large "stimulus" package, but it will be essential to craft it in a way that emphasizes incentives to create and accumulate productive capital, both private and public. On the tax side, we also have options. There are far more possibilities than simply preserving or discarding the Bush tax cuts. Frankly, I was never a fan of those cuts, which added more variation, not less, in tax rates across various forms of income. Ideally, efficient tax systems should feature flat rates and very broad bases. You define income in a very wide manner, and you tax it all at the same rate. You introduce a progressive tax structure by creating large exclusions from taxes at low income levels, so that people at lower income scales pay no tax at all. In my view, the same thing should be done with Social Security - drop the rate substantially, but include all income - wage and non-wage. Three-quarters of Americans pay more in payroll taxes than in income taxes. By reducing the wedge between the hourly amount earned by employees and the hourly cost paid by employers, this strategy would create immediate incentives for employment. Moreover, it would raise more revenue because at present, even Warren Buffett only pays Social Security taxes on the first $106,800 of income. Combining a flatter income tax with a flatter and broader payroll tax would stimulate growth, employment, and greater economic efficiency without compromising total revenues. As economist Alvin Rabushka at the Hoover Institution has observed, "Critics of tax reform believe—with some justification—that the combination of a regressive payroll tax with a flat-rate income or sales tax would make the overall federal tax code more favorable to the wealthy. But a modification of the payroll tax, in conjunction with replacing the current, multibracket, complicated income tax with a flat tax or a sales tax, would represent a fair solution. A reduction in marginal income tax rates on wealthy households would be offset by higher Social Security taxes on them." As for capital gains taxes, the subtle bifurcation of the word "capital" has always fascinated me as an economist. There is a great deal of economic theory that suggests, correctly I think, that reducing the tax burden on capital investment can have pro-growth effects. But this research emphatically refers to "capital" in the real, tangible, productive sense. It does not refer to fluctuations in the value of securities. I am all for significant tax credits for real capital investment and R&D, which would be passed on to shareholders as an increase in the returns to productive investment activities. But it is a stretch to use the economic research on real investment and quietly redefine "capital" as financial capital in order to reduce taxes on security price fluctuations. Wages are income. Capital gains are income. Dividends are income too, but unless we want to perpetuate economic incentives that allow companies to report earnings and then squander excess retained earnings on speculative acquisitions and incentive compensation to insiders, dividends should only be taxed once. Simply put, dividends should be either deductible from corporate income and taxed as ordinary income, or they should be payable out of after-tax corporate income and then distributed as untaxed income at the individual level. If we want to provide tax credits for investment, and eliminate or reduce the tax on the sale or disposition of real physical capital that appreciates in value, that's fine too. But I frankly see no reason why income from securities is sacrosanct from a tax standpoint and the wages people earn are not. Don't Take the Bait Investors who allow Wall Street to convince them that stocks are generationally cheap at current levels are like trout - biting down on the enticing but illusory bait of operating earnings, unaware of the hook buried inside. I continue to urge investors to have wide skepticism for valuation metrics built on forward operating earnings and other measures that implicitly require U.S. profit margins to sustain levels about 50% above their historical norms indefinitely. Forward operating earnings are Wall Street's estimates of next year's earnings, omitting a whole range of actual charges such as loan losses, bad investments, restructuring charges, and the like. The ratio of forward operating earnings to S&P 500 revenues is now higher than it has ever been. Based on historical data (see August 20, 2007 Long Term Evidence on the Fed Model and Forward Operating P/E Ratios), the profit margin assumptions built into forward operating earnings are well beyond two standard deviations above the long-run norm. This is largely because, as Bill Hester noted in his research article last week, forward operating earnings are heavily determined by extrapolating the most recent year-over-year growth rate for earnings. In the current instance, this is likely to overshoot reality, and in any event, has little to do with the long-term cash flows that investors can actually expect to receive over time. I can't emphasize enough that when you hear an analyst say "stocks are cheap based on forward operating earnings" it would be best to replace that phrase in your head with "stocks are cheap based on Wall Street's extrapolative estimates of a misleading number." More sober and historically reliable measures of market valuation create a much more challenging picture. Apart from our own measures, which indicate continued overvaluation, there are several good indicators of market valuation that are not overly sensitive to year-to-year fluctuations in profit margins. One is based on the 10-year average of actual net (not operating) earnings, which is advocated by economist Robert Shiller, and another is Tobin's "q" ratio which is based on comparing market value to replacement cost, and is advocated by Andrew Smithers. Both of these measures largely agree with our own measures, both presently and on a historical basis. Based on last week's valuations, both suggest that the S&P 500 is substantially overvalued.
[Geek's Note: The chart above is based on the ratio of the CAPE and q to their respective historical averages. Note that the axis is logarithmic, so the level of 0.4 corresponds to a valuation ratio of exp(0.4). This is about 1.5, or 50% overvalued. In contrast, major secular buying opportunities as we observed about 1950 and again in 1974 and 1982 occurred at values of about -0.6, which corresponds to a ratio of log(-0.6). This is about 0.55, implying that the market at those points was about 45% below historical norms.] Ultimately, the value of any security is the properly discounted stream of cash flows that the security will deliver into the hands of investors over time. It is very convenient for Wall Street to operate on the basis of "operating earnings" - which aren't even defined under Generally Accepted Accounting Principles (GAAP) - because this measure of earnings is detached from any need to properly deal with portions of earnings that are lost to writeoffs, "extraordinary" losses, option grants to insiders, and so forth. Yes, these items appear in net earnings, but to most analysts, it is apparently unimportant if companies repeatedly write off previously reported "earnings" as losses, or quietly divert them to incentive compensation - all of that is water under the bridge even if it occurs quarterly. Still, net earnings represent the only amounts that investors can hope to obtain, and then only if the net earnings are distributed as dividends or invested in productive activities that don't get written off later. It's those net earnings that go into the calculation of Shiller's cyclically-adjusted P/E (CAPE), and the results are not kind here. A couple of weeks ago, I was in a CNBC segment discussing economic conditions. I decline the vast majority of media requests, but I thought it was important to talk about the economic risks we're observing. It was a debate-style format with another analyst who essentially recapped the same arguments that he made at the 2007 market peak. Indeed, just before the market plunged by more than half, he asserted "the fundamental underpinnings of stocks are superb." He later appeared on CNBC in January 2008 sporting a beard, asserting that all of the recession talk was overblown, and telling a reporter at TheStreet that he would not shave the beard "until the recession talk ends or housing recovers, whichever comes first." As of a couple of weeks ago, he had no beard, which was perplexing. Now, while I have difficulty with analysts who repeatedly lead investors down the primrose path to abominable losses, my defensive approach has also left enough on the table from time to time that I don't want to throw stones. Still, one feature of his analyst's argument was different from 2007, and the more I've thought about it, the more I realize how damaging it could be to investors, so I think it's important to discuss. Specifically, instead of using forward operating earnings to assert that stocks were cheap, he based his valuation assessment this time on NIPA profits (from quarterly GDP accounting). Quoting NIPA profits in the context of market valuations struck me as odd, but the segment immediately jumped to another question. Part of the reason I don't do much TV. You can't thoughtfully discuss the financial markets in 20-second sound bites. Here are the basics. NIPA profits (from the National Income and Product Accounts, compiled by the Bureau of Economic Analysis) are a quarterly measure of economy-wide profits, restricted to current production, less associated expenses. As economists at the Department of Commerce and the BEA have noted (Mead, Moulton and Petrick, 2004), this measure of earnings deviates substantially from S&P 500 earnings. Expenses used in the calculation of NIPA profits exclude bad debts, resource depletion, disposition of assets and liabilities, capital losses, and any deductions relating to the treatment of employee stock options. It also includes an allowance for misreporting of corporate income. Many of these calculations are only available on an annual basis, with a considerable lag, and as a result, quarterly NIPA profit estimates and revisions make significant use of interpolation and extrapolation. Moreover, the NIPA estimate deviates from S&P 500 earnings not only because it excludes all sorts of expenses that are relevant to shareholders, but also because it covers the entire universe of U.S. companies, including small businesses, Sub-S corporations, and mid-sized companies that are not in the S&P 500. Indeed, S&P 500 earnings as a share of NIPA profits have fluctuated between 38% and 85% over the past couple of decades. Except for a slight amount of predictable mean reversion when S&P 500 net income declines during recessions, there is no correlation at all between divergences between NIPA profits and S&P 500 earnings (net or operating) and subsequent changes in S&P 500 earnings. So they aren't reliably predictive of anything. In short, the NIPA profit estimate is a frequently revised, noise-ridden, extrapolation-based quarterly data point, reported with a substantial lag, that excludes a host of shareholder-relevant expenses, and covers a broadly different universe of companies than does the S&P 500. So I've been asking myself, why would anyone want to use NIPA profits to value the market, instead of using actual earnings reports, or even forward operating earnings which are already a sufficiently overblown measure of corporate performance? The only answer I can come up with is that NIPA profits are an even more overblown and misleading measure, allowing the continued assertion that stocks are undervalued. To give you some idea of the distinction, the following chart shows S&P 500 earnings (TTM) versus NIPA profits, scaled so that each series begins at the same value in 1963. Notice that in 1963, both measures would have (by construction) given you the same P/E multiple. But presently, the NIPA line is over 60% higher than the net earnings line (the same is true for 10-year averages), so any P/E based on NIPA profits is substantially and misleadingly low. Again, earnings reports for the S&P 500 companies are directly available. The NIPA figure does not even cover the same universe of companies as the S&P 500, and excludes a whole host of relevant expenses. In effect, by using NIPA profits, you gradually skew the profile of valuations over a period of decades so that what would normally represent clear overvaluation today is transformed into something that looks soothingly appropriate. It is not.
Market Climate As of last week, the Market Climate for stocks remained characterized by unfavorable valuations and unfavorable market action. The Strategic Growth Fund remains fully hedged here - nearly fully invested in individual stocks, with an offsetting short sale of approximately equal dollar value in major indices such as the S&P 500, Russell 2000 and Nasdaq 100, to mute the impact of market fluctuations from the portfolio. Provided that our long-put/short-call index option combinations have identical strike prices and expirations, when the Fund is hedged, the primary source of day-to-day fluctuations is the difference in performance between the stocks we hold long and the indices we use to hedge. In bonds, the Market Climate last week remained characterized by moderately unfavorable yield levels and still favorable yield pressures. We clipped a bit more of our precious metals position on strength last week, as deflationary concerns are likely to become a primary focus of investors well before inflationary concerns correctly become relevant several years out. Between its inflexibility to political and economic freedom and a banking system that is both underdeveloped and at increasing risk of overinvestment-induced credit strains, my impression is that China is much more likely to stumble than investors may appreciate. To a large extent, the strength in commodities has been tied to very rapid growth assumptions across developing economies. We've generally done best by accumulating commodity exposure when investors are abandoning it. That's not to say I expect a major downturn, but as I've frequently noted, the long-term thesis for gold may be forced to endure shorter term discomfort. Finally, I'm pleased to note that on Thursday, the expense ratio for the Hussman Strategic Growth Fund (HSGFX) was again lowered, this time from 1.04% to 1.02%, reflecting a reduction in the investment advisory fee (approved at the June meeting of the Hussman Funds Board of Trustees), and general growth in Fund assets. Fund expense ratios are affected by a number of factors including fee breakpoints and the level of Fund assets, and may increase or decrease over time.--- The foregoing comments represent the general investment analysis and economic views of the Advisor, and are provided solely for the purpose of information, instruction and discourse. Prospectuses for the Hussman Strategic Growth Fund, the Hussman Strategic Total Return Fund, the Hussman Strategic International Fund, and the Hussman Strategic Dividend Value Fund, as well as Fund reports and other information, are available by clicking "The Funds" menu button from any page of this website. |
|||||||||||||||||||||||||
|
For more information about investing in the Hussman Funds, please call us at
1-800-HUSSMAN (1-800-487-7626) 513-326-3551 outside the United States Site and site contents © copyright Hussman Funds. Brief quotations including attribution and a direct link to this site (www.hussmanfunds.com) are authorized. All other rights reserved and actively enforced. Extensive or unattributed reproduction of text or research findings are violations of copyright law. Site design by 1WebsiteDesigners. |