|
|
||||||
|
|

February 18, 2013 The Siren's Song of the Unfinished Half-Cycle “First you will come to the Sirens who enchant all who come near them. If any one unwarily draws in too close and hears the singing of the Sirens, his wife and children will never welcome him home again, for they sit in a green field and warble him to death with the sweetness of their song. There is a great heap of dead men's bones lying all around... Therefore pass these Sirens by, and stop your men's ears with wax that none of them may hear; but if you like you can listen yourself, for you may get the men to bind you as you stand upright on a cross-piece half way up the mast, and they must lash the rope's ends to the mast itself, that you may have the pleasure of listening. If you beg and pray the men to unloose you, then they must bind you faster.” Homer, The Odyssey (800 B.C., Translated by Samuel Butler) If there is one fatal siren’s song of investing, it is the belief that an unfinished half of the market cycle will remain unfinished. A typical, run-of-the-mill market cycle runs about 5 years in duration (though with a significant amount of individual variation). The typical bull market portion extends about 3.75 years, on average, during which time stocks advance at an annual rate of about 28%. The typical bear market portion extends about 1.25 years, on average, during which time stocks decline at an annual rate also about 28%. Historically, that puts the typical bull market gain at about 152% from trough-to-peak, followed by a bear market decline about 34% from peak-to-trough, for a cumulative full-cycle total return of about 67% (roughly 10.7% annualized). Taking the arithmetic average of past bull market declines (a slightly different calculation), the typical bear market comes in closer to a 32% decline. In any event, notice that even a run-of-the-mill bear market decline wipes out more than half of the preceding bull market advance. To put some perspective of where the market stands at present, and why the siren’s song of the unfinished half-cycle is so dangerous here, the chart below presents the S&P 500 since 1998. Notice in particular that the apparent performance of the market is strikingly different depending on the “lookback” that investors use. The 10-year lookback and the 4-year lookback are particularly misleading because each captures an unfinished half-cycle; essentially a trough-to-peak market move. Such lookbacks are useful only on the assumption that the preceding bear market periods were entirely avoided, and that the next one will be avoided as well. Otherwise, lookbacks with less heroic assumptions (e.g. peak-to-peak across market cycles) are more reasonable.
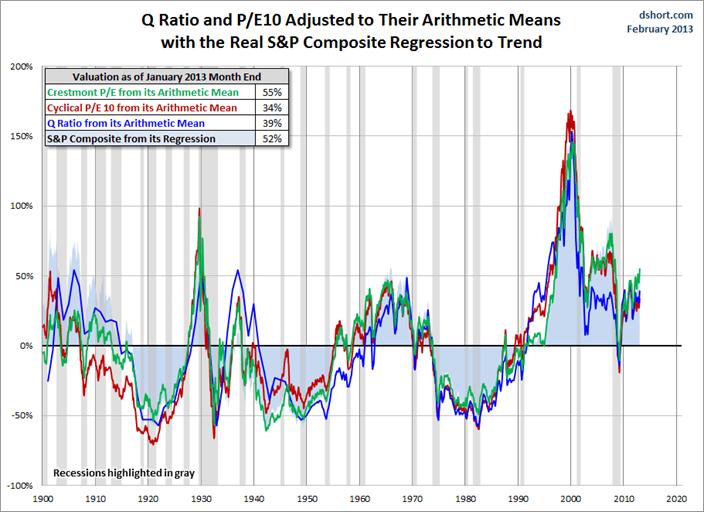
The chart above features two brackets. The first depicts a run-of-the-mill market decline of 32%, which is the historical average of how market cycles are completed. Such a decline would wipe out more than half of the recent bull market advance. The second bracket depicts a 39% bear market decline, which is the historical average for cyclical bear markets that take place within secular bear market periods. In recent weeks, market conditions have established an overvalued, overbought, overbullish, rising-yield syndrome in a mature bull market; conditions that uniquely marked the peaks of advances in 1929, 1972, 1987, 2000, 2007, and 2011 (see A Reluctant Bear’s Guide to the Universe). The instance in 2011 preceded a forgettable market decline near 20%. The other points represent a Who’s Who of tops preceding the most violent market losses in history – even if the most severe outcomes were not immediate. While the 1987 and 2000 instances coincided with the exact market peaks, the average lead time to the market’s ultimate peak was about 4 weeks, and in 2011 took as long as 15 weeks. In every case but 2011, the market peak was within 3% of the point that this syndrome emerged, with the largest gain being a 6% advance observed in the 2011 instance. It is impossible to know whether the recent advance will remain within these prior ranges. The record-high of the S&P 500 was 1565 on October 9, 2007, and that level is only a few percent away. With sentiment already ebullient on nearly every objective measure, a new market high would put a cherry on top, and that should not be ruled out. If you are a buy-and-hold investor and are committed to that discipline, or if you are following some other investment strategy with a clearly defined exit criterion, it’s perfectly fine to ignore my own concerns (and the fact that our most extreme exit critierion has been now been in place for three weeks). Still, investors who do so should make that decision explicitly, with an understanding of the implications of that choice – as in “I am consciously choosing, here and now, to ignore the potential for the current market cycle to be completed by a bear market, either because I am willing to hold stocks regardless of their future course, or because I will adhere to some well-tested investment discipline that has been reliably capable of avoiding major losses.” Whatever discipline you choose, be sure you understand how it has performed historically in a score of previous market cycles. Stress-test it now against the most challenging market data you can obtain - it is reckless to believe that the markets will be forever bailed out in every future crisis. Know how often you would have been whipsawed. Except for a buy-and-hold approach, improve your discipline where you can, provided that those improvements would also have enhanced performance in prior market cycles - particularly in "holdout data" that was unused during the improvement process. Understand that not all points of discomfort are an indication that something needs fixing - particularly when the "fix" would be to sell at an undervalued, oversold, overbearish low, or to buy at an overvalued, overbought, overbullish high. If you are a trend-follower, recognize the psychological difficulty of following a trend-following exit when the market is already down substantially. But whatever discipline you’ve tested fully and your risk-tolerance can accept, commit to following that discipline as the market cycle unfolds. Because whether you hear the siren’s song at the end of a bullish half-cycle, or instead at the end of a bearish half-cycle, the unfortunate fact – as Homer understood – is that discipline is hard work. It is also the only thing that will keep you from running your ship into the rocks. Are Stocks In A New Secular Bull Market? Historically, “cyclical” market fluctuations have occurred in the context of much longer transitions from extremely rich valuations to extremely depressed valuations. These longer cycles drive what are called “secular” bull and bear markets. Essentially, a secular bull period comprises several cyclical bull-bear cycles, where each bull market achieves a successively higher level of market valuation at its peak. A secular bear period has also typically compresed several cyclical bull-bear cycles, where each bear market achieves a successively lower level of market valuation at its trough. As I noted in Hanging Around, Hoping to Get Lucky, extended "secular" moves from extreme undervaluation to extreme overvaluation (or vice-versa) have historically taken about 15-18 years in each direction. At secular bear market lows, the Shiller P/E (S&P 500 divided by the 10-year average of inflation-adjusted earnings) has typically been about 7, as we saw in 1942-1950 and in 1982. By contrast, at secular bull market highs, the Shiller P/E has typically exceeded 24, as we saw in 1929, 1965, and 2000 (the present multiple is 22.7). Doug Short presented a good historical overview of valuations last week using a variety of metrics. By our own estimates, we expect the nominal total return on the S&P 500 over the coming decade to average about 3.8% annually, though with very broad cyclical fluctuations producing that overall result.
Given the extent and maturity of the recent advance, it’s very odd that analysts are now beginning to toss around the idea that stocks have entered a secular bull market. These notions are based not on the level of valuation, nor on the typical 15-18 year duration secular bear markets (if this is a secular bull, it follows that the secular bear lasted only from 2000 to 2009). Instead, it is based on the idea that stocks have gone nowhere for a long time and the recent advance might be enough to break the downtrend we’ve seen in the inflation-adjusted S&P 500 since 2000. Unfortunately, secular bull markets do not begin simply because stocks have gone nowhere for a long while or because the market breaches some trendline. They begin at the point that valuations become so depressed - again, about 7 on the Shiller P/E - that strong and sustained long-term returns are baked in the cake. Similarly, secular bears tend to begin at the point where valuations are so extreme - about 24 or higher on a Shiller P/E - that weak and ephemeral long-term returns are baked in the cake. The intervening secular moves simply take the market from one extreme to another over the course of something on the order of 15-20 years. We can show this with basic arithmetic. Historically, nominal GDP growth, corporate revenues, and even cyclically-adjusted earnings (filtering out short-run variations in profit margins) have grown at about 6% annually over time. Excluding the bubble period since mid-1995, the average historical Shiller P/E has actually been less than 15. Therefore, it is simple to estimate the 10-year market return by combining three components: 6% growth in fundamentals, reversion in the Shiller P/E toward 15 over a 10-year period, and the current dividend yield. It’s not an ideal model of 10-year returns, but it’s as simple as one should get, and it still has a correlation of more than 80% with actual subsequent total returns for the S&P 500: Shorthand 10-year total return estimate = 1.06 * (15/ShillerPE)^(1/10) – 1 + dividend yield(decimal) For example, at the 1942 market low, the Shiller P/E was 7.5 and the dividend yield was 8.7%. The shorthand estimate of 10-year nominal returns works out to 1.06*(15/7.5)^(1/10)-1+.087 = 22% annually. In fact, the S&P 500 went on to achieve a total return over the following decade of about 23% annually. Conversely, at the 1965 valuation peak that is typically used to mark the beginning of the 1965-1982 secular bear market, the Shiller P/E reached 24, with a dividend yield of 2.9%. The shorthand 10-year return estimate would be 1.06*(15/24)^(1/10)+.029 = 4%, which was followed by an actual 10-year total return on the S&P 500 of ... 4%. Let’s keep this up. At the 1982 secular bear low, the Shiller P/E was 6.5 and the dividend yield was 6.6%. The shorthand estimate of 10-year returns works out to 22%, which was followed by an actual 10-year total return on the S&P 500 of ... 22%. Not every point works out so precisely, but hopefully the relationship between valuations and subsequent returns is clear. Now take the 2000 secular bull market peak. The Shiller P/E reached a stunning 43, with a dividend yield of just 1.1%. The shorthand estimate of 10-year returns would have been -3% at the time, and anybody suggesting a negative return on stocks over the decade ahead would have been mercilessly ridiculed (ah, memories). But that’s exactly what investors experienced. The problem today is that the recent half-cycle has taken valuations back to historically rich levels. Presently, the Shiller P/E is 22.7, with a dividend yield of 2.2%. Do the math. A plausible, and historically reliable estimate of 10-year nominal total returns here works out to only 1.06*(15/22.7)^(.10)-1+.022 = 3.9% annually, which is roughly the same estimate that we obtain from a much more robust set of fundamental measures and methods. Simply put, secular bull markets begin at valuations that are associated with subsequent 10-year market returns near 20% annually. By contrast, secular bear markets begin at valuations like we observe at present. It may seem implausible that stocks could have gone this long with near-zero returns, and yet still be at valuations where other secular bear markets have started – but that is the unfortunate result of the extreme valuations that stocks achieved in 2000. It is lunacy to view those extreme valuations as some benchmark that should be recovered before investors need to worry. The following chart presents an annotated market history since 1940. Note that there are a few points where the estimate of prospective market returns would have differed from the actual market returns achieved by the S&P 500 over the following decade. These deviations happen to be very informative. When actual returns undershoot the estimate from a decade earlier, it is almost always because stocks have moved to significant undervaluation. When actual returns overshoot the estimate from a decade earlier, it is almost always because stocks have moved to significant overvaluation. Note the overshoot of actual market returns (versus expected) in the decade since 2002. The reason for this temporary overshoot is clear from the chart at the beginning of this weekly comment: the most recent 10-year period captures a trough-to-peak move: one full cycle plus an unfinished bull half-cycle.
Valuations are presently rich on every well-tested metric – even forward operating earnings, provided they are not used naïvely (see Valuing the S&P 500 Using Forward Operating Earnings). Secular bull markets don’t begin at valuations associated with 3.8% annual returns for a decade – secular bears do. The near-zero returns of the S&P 500 since 2000 were the predictable outcome of extreme valuations. Valuations have moved from stratospheric in 2000, to about average in 2009, to rich-but-not-stratospheric today. Still, valuations are easily rich enough to produce disappointing returns, with significant volatility, over the coming decade. The next secular bull market will be born of much more attractive valuations and opportunities than are available to investors here. A Note on Profit Margins As a side note, we’re quite aware of the seemingly “reasonable” valuation of the market, on the basis of the forward operating earnings estimates of Wall Street analysts, at least on the basis of simplistic “price/forward earnings” multiples. Unfortunately, these estimates reflect profit margins that remain about 70% above historical norms, and are primarily driven by unusually large budget deficits and depressed private savings (the deficit of one sector must be the surplus of another in equilibrium – see Too Little to Lock In for the accounting relationships here). While the relationship between economic deficits and surpluses is actually an accounting identity, some observers have argued that the surge to record profit margins in the past few years (mirroring the reduction in government and private saving over the same period) is actually a permanent reflection of higher profit margins from international sales. Let’s examine that argument. Foreign sales represent about 46% of total sales of S&P 500 companies (up from about 41% in 2003). Since then, S&P 500 revenues are up about 33%, while taxes paid to foreign governments have increased by about 50% (S&P 500 companies presently pay more taxes to foreign governments than to the U.S. government). Assuming relatively fixed tax rates, this indicates that profits earned by S&P 500 companies on foreign earnings have increased by roughly 12.8% (e.g. from 8% profit margins to 9% margins) in recent years, on a 5% increased international share of total sales. Even considering the combined effect of somewhat greater international sales on somewhat higher profit margins, it is impossible to account for the overall change in corporate profit margins on that basis. It would be one thing if the rise in profit margins was even a mystery, but margins have remained highly cyclical (reflecting identical cyclical movements in household and government saving), and have remained tightly related to deficits in other sectors, and must be as a consequence of economic equilbrium. Of course, we can express that equilibrium in other terms with equal accuracy. For example, it's accurate to say that corporate profits are at a record share of GDP because wages are at a record low share of GDP, but that households are still able to maintain their consumption because government transfer payments have surged to a record share of GDP. We can even explain part of the suppression of domestic wages as being due to competition from cheaper foreign labor (although this explanation is partial at best). This detail adds some insight, but regardless of the interpretation one puts on the data, it remains true that corporate profits are at a record high relative to GDP because household saving is depressed and government deficits are extreme. These extremes are unlikely to sustained for anywhere close to the horizon that is relevant for pricing stocks. I should note that the same accounting relationships that hold for the domestic economy hold for the global economy (with the added feature that global trade deficits and surpluses need not be considered since they balance out). On a global basis, corporate profits can be expressed as the surplus of global investment (factories, plant, equipment) over the sum of household savings and government savings. A decline in global investment, other things being equal, is also observed as a decline in corporate profits. A reduction of household savings and government savings, other things being equal, means that spending is being done by these sectors in the absence of offsetting income, and is therefore associated with an increase in corporate profits. This is what we’ve observed in recent years, but Wall Street is essentially betting that this situation will be permanent. A decline in government deficits globally, particularly coupled with any attempt by households to save or any reduced initiative to invest, would exert a particularly negative effect on profits.
[Geek's Note: Technically, to be generally applicable across countries, the chart above would include the difference between "foreign saving" (the inverse of the current account deficit) and Gross Domestic Investment. But in U.S. data, these two move closely in tandem. That is, "improvement" in the trade balance is generally matched by deterioration in Gross Domestic Investment, and improvement in GDI is generally matched by deterioration in the trade balance. As a result, the difference between foreign saving and GDI doesn't fluctuate much and has a small net effect on corporate profits]. Economic Notes I’ve been fascinated in recent weeks by the rather intense gap between the unrestrained economic optimism of Wall Street and the actual data. The high-frequency data (weekly and even monthly) is feeding quite a bit of enthusiasm here, while the lower frequency data (3-month averages, quarterly, and year-over-year) is significantly more downbeat. Dwaine Van Vuuren always provides food for thought on the economic front. Based on the latest quarterly GDP figures, the recent explosion in the number of countries in economic contraction is striking.
This from Bill Hester: “The graph below maps out global recessions using recession data from the Economic Cycle Research Institute (by permission). It shows recession periods for each country listed since the early 1970’s. Probably one of the most visible features of this graph is that individual country recessions tend to be shared globally. There are a few cases – Japan, clearly being one of them - where countries enter into recession without the company of other countries. But the majority of local recessions coincide with global recessions. The early 1970’s, early 1980’s, early 1990’s, and 2008 all represent global recessions.”
The foregoing comments represent the general investment analysis and economic views of the Advisor, and are provided solely for the purpose of information, instruction and discourse. Only comments in the Fund Notes section relate specifically to the Hussman Funds and the investment positions of the Funds. Fund Notes As of last week, market conditions continued to be characterized by an unusually extreme syndrome of overvalued, overbought, overbullish, rising interest rate conditions (see A Reluctant Bear’s Guide to the Universe). Strategic Growth Fund remains fully hedged, with an additional fraction of one percent of assets in a staggered-strike position, which raises the strike prices of our put options somewhat closer to market levels. Except in the event of a significant market decline, most of the day-to-day fluctuation in Fund value can be expected to be driven by the difference in performance between the stocks held by the Fund and the indices it uses to hedge (primarily the S&P 500 Index). Strategic International remains fully hedged. Strategic Dividend Value is hedged at about half the value of its stock holdings, and Strategic Total Return continues to hold a duration of just over 3.5 years (meaning that a 100 basis point move in interest rates would be expected to impact Fund value by about 3.5% on the basis of bond price fluctuations), with less than 10% of assets in precious metals shares, and about 5% of assets in utility shares. --- The foregoing comments represent the general investment analysis and economic views of the Advisor, and are provided solely for the purpose of information, instruction and discourse. Prospectuses for the Hussman Strategic Growth Fund, the Hussman Strategic Total Return Fund, the Hussman Strategic International Fund, and the Hussman Strategic Dividend Value Fund, as well as Fund reports and other information, are available by clicking "The Funds" menu button from any page of this website. |
|||||||||||||||||||||||||
|
For more information about investing in the Hussman Funds, please call us at
1-800-HUSSMAN (1-800-487-7626) 513-326-3551 outside the United States Site and site contents © copyright Hussman Funds. Brief quotations including attribution and a direct link to this site (www.hussmanfunds.com) are authorized. All other rights reserved and actively enforced. Extensive or unattributed reproduction of text or research findings are violations of copyright law. Site design by 1WebsiteDesigners. |