|
|
||||||
|
|

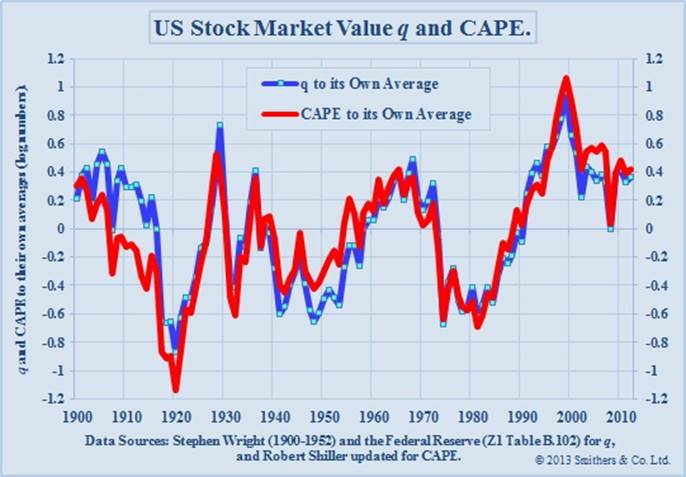
April 1, 2013 We Should Already Have Learned How This Will End Overvalued, overbought, overbullish. When in history have we seen the Shiller P/E (S&P 500 divided by the 10-year average of inflation-adjusted earnings) above 23, the S&P 500 over 60% above its 4-year low and 10% above its 52-week average, with investment advisory bears below 20% for at least two weeks running? Three times: the April 2010 peak, the March-May 2011 peak – both followed by corrections approaching 20% – and today. Even if one ignores the historical evidence suggesting the potential for significant bear market losses over the next couple of years, speculators should be aware that present conditions have been hostile even in the context of the recent bull market advance. I use the word “speculators” intentionally, as the historical evidence overwhelmingly indicates that there is little in the way of “investment” merit at present valuations. See Investment, Speculation, Valuation, and Tinker Bell for a review of the simplistic “forward earnings” measures universally touted by Wall Street here, compared with a range of distinct valuation approaches (including a far more effective use of forward earnings), all which reach nearly identical conclusions, and all which have a dramatically stronger relationship with subsequent market returns at every horizon. Our present estimate of prospective 10-year S&P 500 nominal total returns is now down to about 3.5% annually. Andrew Smithers out of London provides yet another metric based on Tobin’s q (market value versus replacement cost). The chart below is on log scale, so you have to do a bit of math to translate to percentage over/undervaluation, for example, exp(0.42) = 1.52, or 52% overvaluation. The chart is based on data through the end of 2012. Smithers notes “At that date the S&P 500 was at 1426 and US non-financials were overvalued by 44% according to q and quoted shares, including financials, were overvalued by 52% according to CAPE. With the S&P 500 at 1552 the overvaluation was 57% for non-financials and 65% for quoted shares.”
Unfortunately, that seems about right. Let’s translate this into an estimate of prospective 10-year total returns, assuming underlying nominal economic growth rate of about 6.3% (which may be optimistic, but is a robust peak-to-peak norm across economic cycles, and is unlikely to be pessimistic), and a dividend yield of about 2.2% on the S&P 500. With that, a 65% overvaluation in quoted shares, reverting to fair valuation a decade from now, would imply a 10-year annual nominal total return on the S&P 500 of 1.063*(1/1.65)^(1/10) + .022 – 1 = 3.3% annually. That’s right in line with the estimates we obtain from a wide range of other historically reliable approaches (historically reliable in italics, because the “Fed Model” is not). Notice that in 1982, the -0.7 reading on Smithers’ log-scale chart implied that stocks were undervalued by exp(-0.7)-1 = -50%. At that point, with the dividend yield on the S&P 500 about 6.7%, one would have estimated a 10-year prospective total return for the S&P 500 of 1.063*(1/0.5)^(1/10)+.067 – 1 = 20.6% annually. One would have been correct. In contrast, note that in 2000, the 1.0 reading implied that stocks were overvalued by exp(1.0)-1 = 172%. At that point, with the dividend yield on the S&P 500 at just 1.2%, one would have estimated a 10-year prospective total return for the S&P 500 of 1.063*(1/2.72)^(1/10)+.012 = -2.6% annually. Again, one would have been correct. Not only are all of these distinct valuation methods quite accurate historically, but we can also fully explain their divergence from simplistic forward earnings approaches, using decades of data on corporate profits, government deficits, and household saving, spanning from the 1940’s to the present. This evidence hammers down two points: corporate profit margins are nearly 70% above their historical norm precisely because of the spectacular combined deficit of government and households, as the deficit of one sector must emerge as the surplus of another; and every bit of historical evidence indicates that elevations in corporate profits are mean reverting, being followed by negative or significantly below-average earnings growth over subsequent years. See Two Myths and a Legend to review the historical evidence in this regard. With due respect to Howard Marks and Warren Buffett At present, we estimate a 10-year total return on the S&P 500 over the coming decade averaging just 3.5% annually, with zero total returns over a horizon of about 7 years, and expected losses for the S&P 500, including dividends, over shorter horizons. While our estimates for 10-year total returns exceeded 10% annually near the 2009 market lows, the recent advance has, in effect, “eaten” most of those prospective returns. The well-admired bond manager Howard Marks is very correct when he notes “appreciation at a rate in excess of the cash flow accelerates into the present some appreciation that otherwise might have happened in the future.” Where I differ from even Howard Marks and Warren Buffet here, is that if you are going to rely on a summary measure in order to value long-lived assets like stocks (both Marks and Buffett point to “forward operating earnings” today), that summary measure must be representative of the long-term stream of cash that investors can expect to receive over time. The hook today is that investors are using analyst estimates of next year’s operating earnings as if they are representative of the entire long-term stream, and that this one number can be used as a "sufficient statistic" for long-term corporate profitability. Profit margins are about 70% above their historical norm, largely driven by the massive combined deficit of government and households at present (again, see Two Myths and a Legend to see the tight and consistent relationship between corporate profits and the combined deficit of government and households, as the deficit of one sector must be the surplus of another). Moreover, we can show that the simplistic use of forward operating earnings is much less correlated to subsequent market returns than a wide variety of other approaches that smoothly adjust the “summary measure” so that it is less prone to uninformative cyclical fluctuations. All of that said, on horizons that are shorter than a few years, our valuation estimates often do not matter much. Over that time frame, the perceptions of investors – whether correct or incorrect – can still create the reality that we observe in stock prices. Trend-following approaches can be helpful in these circumstances, but we’ve found them to be markedly less useful once overvalued, overbought, overbullish conditions are established. The problem isn’t that these overextended conditions halt market advances in their tracks. Rather, they create a situation where the initial decline from those advances can wipe out weeks or months of market gains in a few days, and where prices are so far above “trend-following” support levels that no practical exit is possible on those measures. We should already have learned how this will end We strongly expect the ending of the present market cycle to wipe out the majority of market gains since 2009 (even a standard, run-of-the mill bear market wipes out more than half of the preceding bull market gain). We already know that the market is strenously overvalued, overbought, and overbullish. We know that these conditions have historically made trend-following measures unreliable. What we don’t know is precisely when today's compressed and complacent risk premiums will crawl or spike higher, and one thing we’ve learned from testing hundreds of investment methods over a century of data is that many approaches that perform beautifully over the long-term would often have felt intolerable at a day-to-day resolution. To some extent, that’s the problem with much of the research and evidence that we’ve presented involving long-term data. Frankly, I don't believe there is much question that our concerns will prove correct. The question is whether investors will abandon a proper, studied, but uncomfortable defensiveness, as many did in 2000 and 2007, because they could no longer bear to witness the temporary success of reckless speculators. On a chart that spans 50 or 70 years of data, it’s easy to see how overvalued, overbought, overbullish periods were violently resolved over the completion of each market cycle. Large, dramatic moves – 50% market losses in 1973-74, 2000-2002, 2007-2009, and crash-type losses like 1987 – are easy to identify on these charts, each preceded by adequate warning. Still, seemingly relentless, late-stage bull market advances would have been very uncomfortable to miss if an investor was defensive in anticipation of the weakness that ultimately followed. As I’ve often noted, there are numerous useful ways to define an “overvalued, overbought, overbullish, rising-yield” condition. In practice, we use a number of definitions, from wide (capturing about 4.5% of historical data) to narrow (capturing about 1%). When these conditions have become particularly extreme, I’ve typically identified them by reviewing the small handful of instances that fall into the same criteria (see for example, A Reluctant Bear’s Guide to the Universe). Yet despite all of the evidence that we’ve provided about these syndromes, as well as valuation methods, impermanent distortions, and profit margins that provide a misleading “hook” for bullish investors, I think I may not have stressed clearly enough the challenge that transitory market fluctuations pose in maintaining an informed long-term discipline. The coarse, full-cycle considerations that actually matter over the long-term are constantly obscured by the finer short-term considerations that investors experience day-to-day. To demonstrate the difference, I’ve chosen a particular set of criteria to define extreme conditions – partly because they identify the most memorable market peaks in history, but also to emphasize how difficult they would have been to follow in practice, because most of the signals were early. Though many of the signals were followed by some amount of correction fairly quickly, severe losses often began months later, and didn’t exert their full force for several quarters. So purely for exposition (again, this isn’t our working definition in practice), we’ll define overvalued, overbought, overbullish, rising-yield conditions as follows: Overvalued – Shiller P/E of 18; Overbought – S&P 500 at least 9% above its 12 month average, 50% above its 4-yr low, and at a 4 year high; Overbullish – Investors Intelligence bearish sentiment below 26%; Rising yields – 10-year Treasury yield higher than 6 months earlier. The historical points corresponding to these criteria are identified by the blue lines, with the S&P 500 Index (log scale) in red. Note that this particular set of criteria became active about 4 weeks ago, at about 1550 on the Index.
On a long-term chart like this, it’s easy to see that each instance – even 1964 – was ultimately followed by substantially lower market levels, and better investment opportunities for investors having a full-cycle investment perspective. What I want to emphasize here is how difficult investors would have found it to maintain a defensive discipline in real-time. Notice that this set of criteria indicated an overvalued, overbought, overbullish, rising-yield condition in March 1964, at a level of about 80 on the S&P 500. Yet the S&P 500 advanced to 90 by May 1965, experienced a brief correction of less than 10%, and then advanced to 94 by February 1966, gaining about 20% over that two-year period. Put yourself in the shoes of investors at that optimistic market peak. Remember that they were yet to watch the S&P 500 quickly lose all of those gains, and then some, in the 1966 bear market, and would go on to discover that stocks would underperform Treasury bills for another 16 years. From an investment perspective, the March 1964 signal was a clear warning of a late-stage, overvalued advance, but it was quite early from a speculative perspective. Even though the 1966 bear market (that wiped out the intervening gains) was very mild by historical standards, it still produced a good opportunity – without headwinds – by late-1966, when a retreat in valuations was coupled with an early improvement in market action. As I’ve noted many times, those are the points in the market cycle that properly deserve the enthusiasm of investors. Similarly, this set of criteria indicated an overvalued, overbought, overbullish, rising-yield condition as early as May 1972, at about 111 on the S&P 500, but it took months for the market to finally peak in January 1973 at 120. Again, put yourself in the shoes of investors at that point, because it is only in hindsight that we know that the S&P 500 went on to lose nearly half its value, and that it would still be trading below that peak as late as 1982. Notably, the first salvo in that bear market was a decline of about 17% into August 1973, followed by an advance back to 111 by October of that year – which was broadly viewed as a resumption of the bull market. The S&P 500 plunged to 62 a year later, despite a significant increase in S&P 500 earnings and strong payroll growth in the interim. Now consider the 1987 instance. It’s certainly easy to identify on the chart, because the 1987 crash appears to immediately follow the emergence of overvalued, overbought, overbullish, rising-yield conditions. But in fact, the first emergence of this version of the syndrome was in June 1987, at about 307 on the S&P 500. The index then soared to 337 by August, in a nearly relentless day-after-day advance. Put yourself in the shoes of investors during that ramp to new highs day-after-day. It is only in hindsight that we know what happened next (and even then, the S&P 500 was within 8 points of its August high only 10 sessions before the October 19, 1987 crash). It is only hindsight that tempts investors to believe that it would have been easy to maintain a defensive position in response to the warning signs. The next instance was July 1999, at about 1400 on the S&P 500. While the market did experience a 10% correction over the following 3 month period, the market then recovered. Overvalued, overbought, overbullish conditions certainly resurfaced on the basis of less pointed criteria, but bearish sentiment never dipped back below 26% during the remaining advance, which peaked in March 2000 at the 1527 level on the S&P 500. The market again dropped about 10% in the following month, but recovered within 6 points of its high by September. Hindsight makes it easy to believe that it would have been easy to maintain perspective about the downside risk that history had repeatedly demonstrated would follow. Maintaining that perspective in real-time was far more difficult (last week’s comment, The Hook, begins with a retrospective of my own writing at the time). A word of caution – I chose the above set of criteria for expositional purposes, because it has the strength of identifying historical peaks prior to steep losses, but also because it has the weakness of often being frustratingly early. Several of the other syndromes we observe at present have typically had shorter lags, so it is probably dangerous to rely on the recent signals being early – particularly since some of these indications have been in place since March 2012. The more important point is that we see a strong likelihood of precipitous market losses over the completion of the present market cycle, but day-to-day market fluctuations are likely to discourage long-term discipline in favor of impatience and second-guessing of defensive evidence – keeping speculators in the market until a “good exit” is only available in hindsight. The bear market losses that complete each market cycle have different catalysts. Some feature recession, some feature inflation, some feature credit events, but nearly all feature a spike in risk premiums from levels that have become both low and complacent. That’s the underlying risk that overvalued, overbought, overbullish, rising-yield conditions have reliably identified over time. The problem is that there is a great deal of day-to-day optimistic noise that one has to wade through in order to maintain proper concern about those conditions once they emerge. The eventual outcomes are easy to identify on a long-term chart, and because the typical losses were severe, it’s tempting – in hindsight – to imagine that avoiding risk and ignoring reckless optimism at the top would have been easy. But the fact is that day after day of optimistic chatter in these overvalued, overbought, overbullish periods can create uncertainty and lead investors to ignore and forget what they have been taught again and again through painful experience. Having examined the shoes of other investors facing similar overvalued, overbought, overbullish, rising-yield conditions across history, and knowing what they did not appreciate – how those conditions would be resolved – it would be advisable for investors to carefully examine their own shoes today. A bit of advice News item: Barron’s Magazine carried a fairly cheerful article last week – “Wealthy Families Leveraging Up.” They would be well to remember what happened after previous surges in the number of investors who decided that speculating with borrowed money was a brilliant idea.
As I noted a few weeks ago, when we observed a slight decline in the percentage of bullish investment advisors, “If I was to guess, my guess is that these advisors will be drawn back to the bullish camp by a marginal new high in the S&P 500 above its prior record of 1565, with possibly a percent or two of additional euphoria for good measure.” My view is certainly not that the market must decline or cannot advance further – even further than another percent or two. Rather, my view is that whether or not the market advances further, investors are unlikely to retain those gains, are unlikely to encounter the convenient and profitable exit opportunity that they imagine will be available, and are unlikely to observe market losses over the completion of this cycle that are contained at a level anywhere close to the small risks that they imagine. I have little doubt that better investment opportunities will emerge over the course of the present market cycle, and even if the recent bull market continues, that better speculative opportunities will emerge as well. Investors who are not committed to a buy-and-hold investment stance, whatever may come, would be well advised to be sure that their investment discipline is based on well-defined criteria for accepting and avoiding risk, and has been exhaustively tested over many decades of market history (and ideally stress-tested against Depression-era data – trust me on that). A wing and a prayer will not be enough to navigate the completion of the present market cycle, whenever that completion phase begins. The foregoing comments represent the general investment analysis and economic views of the Advisor, and are provided solely for the purpose of information, instruction and discourse. Only comments in the Fund Notes section relate specifically to the Hussman Funds and the investment positions of the Funds. Fund Notes As of last week, market conditions remained characterized by unusually overvalued, overbought, overbullish, rising-yield conditions, nearly irrespective of the criteria we use to define these. We are defensive here, but are far more open to constructive investment positions than the recent cycle may lead investors to believe, particularly at the point where moderate improvement in valuations (more than a mild correction, but less than a shift to undervaluation) is coupled with early improvement in our measures of market action. Still, as I wrote in November 2007, “shareholders can trust that I don't play in minefields with shareholder assets. We don't remove a significant portion of our hedges in overvalued markets with poor market action in an attempt to ‘play’ purely technical bounces of unpredictable size and duration.” Reasonable market valuations (or at least the absence of overvalued, overbought, overbullish conditions), coupled with an early improvement in market action, are what we generally associate with the highest estimated return/risk profiles. Meanwhile, we’ve aligned our betas (the sensitivity of our stock holdings to general market fluctuations) and sector exposures more closely with the indices we use to hedge (though remaining well below market weight in financials and above market weight in health care), while still focusing on holdings that we view as more reasonably valued or as having better estimated return/risk profiles than the S&P 500, Russell 2000 and Nasdaq 100 indices. When the Funds are hedged, much of their day-to-day performance is driven by the difference in performance between the stocks we hold and those indices. Strategic Growth Fund remains fully hedged, with a staggered strike position that raises the strike prices of our put options to a point within several percent of present market levels. We continue to be slow to raise those strike prices further, and except in the event of substantial market losses, most of the day-to-day fluctuation in Fund value is likely to reflect differences in performance between the stocks held by the Fund and the indices we use to hedge. Strategic International also remains fully hedged, Strategic Dividend Value remains hedged at about 50% of the value of its stock holdings, and Strategic Total Return continues to carry a duration of about 3 years in Treasury securities (meaning that a 100 basis point move in interest rates would be expected to affect Fund value by about 3% on the basis of bond price fluctuations), about 10% of assets in precious metals shares, and a few percent in utility shares. --- The foregoing comments represent the general investment analysis and economic views of the Advisor, and are provided solely for the purpose of information, instruction and discourse. Prospectuses for the Hussman Strategic Growth Fund, the Hussman Strategic Total Return Fund, the Hussman Strategic International Fund, and the Hussman Strategic Dividend Value Fund, as well as Fund reports and other information, are available by clicking "The Funds" menu button from any page of this website. |
|||||||||||||||||||||||||
|
For more information about investing in the Hussman Funds, please call us at
1-800-HUSSMAN (1-800-487-7626) 513-326-3551 outside the United States Site and site contents © copyright Hussman Funds. Brief quotations including attribution and a direct link to this site (www.hussmanfunds.com) are authorized. All other rights reserved and actively enforced. Extensive or unattributed reproduction of text or research findings are violations of copyright law. Site design by 1WebsiteDesigners. |