|
|
||||||
|
|

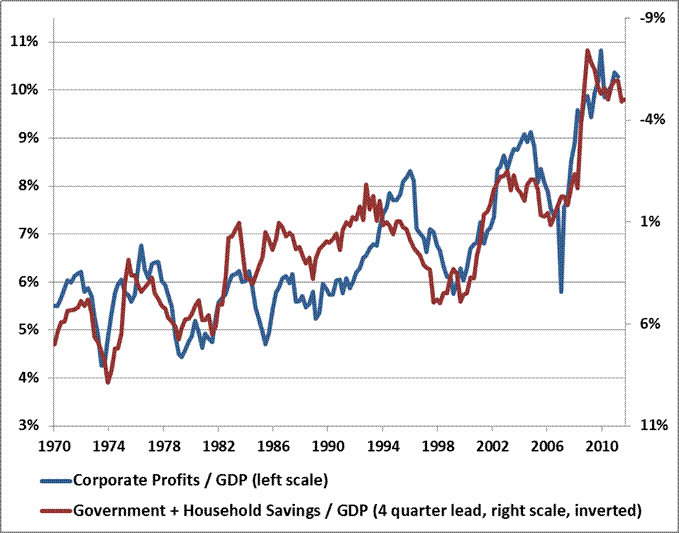
May 13, 2013 Closing Arguments: Nothing Further, Your Honor “For as long as I can remember, veteran businessmen and investors – I among them – have been warning about the dangers of irrational stock speculation and hammering away at the theme that stock certificates are deeds of ownership and not betting slips... The professional investor has no choice but to sit by quietly while the mob has its day, until the enthusiasm or panic of the speculators and non-professionals has been spent. He is not impatient, nor is he even in a very great hurry, for he is an investor, not a gambler or a speculator. The seeds of any bust are inherent in any boom that outstrips the pace of whatever solid factors gave it its impetus in the first place. There are no safeguards that can protect the emotional investor from himself.” - J. Paul Getty I’ve often noted that even a run-of-the-mill bear market decline wipes out more than half of the preceding bull market advance. I doubt that the present instance will be different. Indeed, cyclical bear market declines that occur in the context of secular bear markets average a market loss of about 39%, wiping out about 80% of the prior bull market advance. We presently estimate a nominal total return for the S&P 500 of just 3.2% annually over the coming decade. It is not pessimism, but optimism – and optimism born of a century of evidence – that we expect stocks to provide more favorable opportunities for investment over the completion of this cycle. It is that carefully-studied optimism that leads us to reject the notion that investors are forced to crawl to the ground and “lock in” low prospective long-term returns, while ignoring severe intermediate-term risks to capital. I’ll note in passing that the Shiller P/E reached 24 last week (S&P 500 divided by the 10-year average of inflation-adjusted earnings). Secular bear market lows have typically taken the Shiller P/E below 8 before durable secular bull market advances have taken hold. Valuations are a long way off from that, though I would expect at least one or two more complete bull-bear cycles to emerge before the market achieves valuations that would support a durable secular uptrend. There will be plenty of significant opportunities to periodically accept market exposure even if a secular bull market is nowhere in sight. The perception that investors are “forced” to hold stocks is driven by a growing inattention to risk. But Investors are not simply choosing between a 3.2% prospective 10-year return in stocks versus a zero return on cash. They are also choosing between an exposure to 30-50% interim losses in stocks versus an exposure to zero loss in cash. They aren’t focused on the “risk” aspect of the tradeoff, either because they assume that downside risk has been eliminated, or because they believe that they will somehow be able to exit stocks before the tens of millions of other investors who hold an identical expectation that they can do so. Though the discipline to “sit by quietly while the mob has its day” can be nearly excruciating in the excitement of late-stage bull markets, as the market registers multi-year highs amid rich valuations and heavily optimistic sentiment, it’s worth remembering that the 2000-2002 bear market wiped out the entire total return of the S&P 500 in excess of Treasury bills all the way back to May 1996. Assuming that investors stuck it out to finally regain and surpass the market’s 2000 peak in 2007, the 2007-2009 bear market then wiped out the total return of the S&P 500 in excess of Treasury bills all the way back to June 1995. Think about that. One literally could have sat in Treasury bills through 1996, 1997, 1998, 1999, 2000, 2001, 2002, 2003, 2004, 2005, 2006, 2007, 2008, and into early 2009, and have done better than the S&P 500 did over that entire span of time. Moderate losses are frustrating, but deep, major losses from rich valuations are the ones that matter, because it is difficult to recover from them in a durable way. The recent advance is a gift in that regard. Consider that carefully now, not later. That is not to say that we’re unprepared for the possibility that this bull market will move higher still. If that is to be the case, I would expect that we’ll observe one or more points where a modest retreat from overvalued, overbought, overbullish conditions is joined with an early improvement (or lack of clear deterioration) in trend-following measures. Such points have been the most appropriate times to accept market risk even during the recent bull market advance. As I noted last week, we’ve done a great deal of “exclusion analysis” to refine the pool of instances with negative return/risk profiles, in order to capture the largest set of constructive instances possible – an effort that has been particularly required in an environment where monetary policy is intentionally aimed at driving speculative activity. While I am quite convinced that the completion of the current, unfinished market cycle will involve steep losses that wipe out most of the preceding bull market gains, I am not at all convinced that this journey will involve a total absence of opportunities to shift to moderate or even significantly constructive investment outlook periodically, though I doubt that we would go without some amount of defense without a more significant retreat in valuations. Why does none of this analysis move us to a constructive stance today? Examine market conditions. We have a Shiller P/E of 24, 52.1% bulls versus just 19.8% bears, the S&P 500 pushing into its upper Bollinger bands (two standard deviations above its 20-period moving average) at daily, weekly, and monthly resolutions, the S&P 500 at a multi-year, overbought high, and the 10-year Treasury yield above its level of 6-months prior. Identify similar periods in history (even on less restrictive thresholds), and you’ll find a Who’s Who of major market tops: 2007, 2000, 1987, 1972, and 1929 (on imputed sentiment data). There was also an instance in 2011 that was followed by a near-20% market decline. See Capitulation Everywhere and We Should Already Have Learned How This Will End for a review of market outcomes following similar historical conditions. In short, there will be opportunities to take constructive investment positions, certainly at the completion of the present market cycle, but most likely even in the event that the advancing portion of this cycle continues. Choosing those points, based on demonstrable evidence, is essential. Recklessness, crowd-following, euphoria, fear of missed gains, and monetary superstition has certainly been rewarded lately, in a way that seems indistinguishable from insight and genius. Retaining such windfalls will prove far more difficult. Closing Arguments On quantitative easing The total capitalization of the U.S. stock market is presently about $17 trillion (about $16.2 trillion as non-financials). The Federal Reserve is purchasing $85 billion of Treasury and mortgage-backed bonds each month. This creates a pool of bank reserves that have to be held by someone at each point in time, until those reserves are retired. This zero-interest cash is a hot potato that certainly creates speculative demand. But it is the superstitious aspect of the belief in QE – as if it has some inexplicable power to remove downside risk – that deserves just as much credit for the recent advance. It is the superstition that QE mysteriously removes economic risk, and the psychological discomfort of low interest rates far beyond its true effect on investment value, that has encouraged investors to abandon their demand for a risk premium to adequately compensate them for the risk they are taking. How can we know that? Simple. We can demonstrate that QE is not exerting the bulk of its effects through cash flows or the effect of lower interest rates on earnings or present discounted value. This leaves the suppression of risk premiums as the remaining and primary effect of QE. In other words, QE has not increased the value of equities. It has only increased the price, but that increase in price has no significant fundamental underpinning. To see this, first consider cash flows. Imagine that instead of attempting to boost stock prices indirectly through quantitative easing, the Fed took the candy-land approach of literally handing the $85 billion directly to stockholders to reward them for owning stocks. How much would that direct cash distribution benefit a stock market with a $17 trillion market capitalization? Do the arithmetic. Only 0.5% a month. Yet investors have chased prices at a far more rapid pace as a result of quantitative easing. Remember, of course, that the Fed is not in fact distributing cash to shareholders. What about the benefit of lower interest rates? Domestic nonfinancial corporate debt is presently $8.6 trillion. Even a 4% reduction in interest rates (400 basis points) comes to $344 billion a year. Assume that benefit accrues strictly to publicly traded companies, and extend that benefit over 5 years. It’s still only worth 10% of market capitalization. As a side note, lower interest rates also suppress income from corporate investments, particularly with large amounts of cash on corporate balance sheets. And though it has become a fad to subtract out cash from market capitalization, it is a profoundly incorrect fad. If it was correct, a company with a billion dollars of market cap could issue a billion dollars of debt, hold the proceeds in cash, and the stock could be considered "free." What about higher GDP leading to greater profits and supporting stocks that way? Take the current ratio of corporate profits/GDP of 11% at face value (even though that share is 70% above the historical norm), and let’s even assume that all of these profits go to corporations with publicly traded stocks. How much would GDP have to rise, sustained over 5 years, to justify even a 10% increase in market capitalization? The required amount of additional GDP is 1.7 trillion / 0.11, or $15.5 trillion, or about $3.1 trillion a year sustained over 5 years. The present size of the U.S. economy is about $16 trillion. So yes, if QE could boost the size of the U.S. economy by about 20% and sustain it over 5 years, and the additional earnings could be delivered entirely to stock market investors in cash, it would justify a 10% increase in market capitalization. Here’s one for geeks: What about the effect of a lower capitalization rate on discounted future cash flows? Simple. Take a given initial cash distribution and assume 6% annual growth, which is about the long-term peak-to-peak growth rate of earnings and nominal GDP over the economic cycle. Discount those cash flows annually into the indefinite future. Now drop the discount rate by about 4% (400 basis points) for 5 years. How much does the present discounted value increase? Not much. We’ve certainly seen people correlate the monetary base with the S&P 500 since 2009, ignoring that two rising lines will always have a correlation of over 90%, and inferring targets for the S&P based on assumptions about base money. But this is little more than extrapolation based on statistical misuse. It may very well be that the promise of more QE will produce a reflexive pursuit of stocks in the same direction, but investors should at least be aware that this pursuit has no fundamental basis, and rests purely on the willingness of investors to abandon any need to be compensated for risk. What concerns me most here is the lack of effort that investors are taking to analyze and quantify the mechanism by which quantitative easing should work, beyond a vague superstition that “it just does.” The notes I receive suggesting that somehow QE makes all historical economic relationships, profit margin dynamics, and financial relationships irrelevant remind me of some remarks that appeared in Business Week: “During every preceding period of stock speculation and subsequent collapse there has been the same widespread idea that in some miraculous way, endlessly elaborated but never actually defined, the fundamental conditions and requirements of progress and prosperity have been changed, that old economic principles have been abrogated, that all economic problems have been solved, that industry has suddenly become more efficient than it ever was before ... that business profits are destined to grow faster and without limit, and that the expansion of credit can have no end.” Those remarks unfortunately waited to appear until November 1929. In short, there is no transmission mechanism by which QE has any large and beneficial effect on the value of equities. There has certainly been an effect on price – but this effect is driven by the willingness of investors to abandon their demand for a risk premium that will actually compensate them for the risk they are taking. Recall that during the 2008 market plunge, following aggressive monetary easing throughout the year, the Fed initiated its first program of quantitative easing. While the market’s rebound actually took a good part of a year to emerge (and which appears to have been most closely related to a change in FASB accounting rules that suspended "mark-to-market accounting") investors associated that rebound with ongoing QE. When the next decline occurred in 2010, QE was again initiated, and with investors conditioned to expect QE to produce rising stock prices through some poorly-understood mechanism, the market recovered the loss it had experienced over the preceding 6-month period. Same for the “Twist” in 2011, which was also initiated after a spike in risk premiums. But just as Pavlov’s dogs became conditioned to salivate at the sound of a bell even when they were presented with no meat, investors have now become conditioned to buy stocks in the presence of QE, even without any preceding spike in risk premiums, and even when there is no fundamental basis for doing so. This doesn’t mean that investors will suddenly change their behavior. It does mean that this behavior does not have any reliable fundamental underpinning, and that in turn suggests that all of this will end badly. It is unlikely that investors can or will – in aggregate – get out of the market with their QE-induced gains. On profit margins The facts that savings equal investment and that the deficits of one sector must arise as the surplus of another are not theories. They are identities that must hold true by accounting definition. It does not matter how companies are deriving their profits (domestically or internationally). It does not matter how consumers are obtaining their goods (domestically or internationally). It does not matter how the government is financing its deficits (domestically or internationally). It is true merely and strictly by identity that savings equal investment, and that the deficits of one sector must arise as the surplus of another. The exact way that this comes about is up for grabs, but the end result is not. It is also true empirically in decades of data since the 1940’s that the following aspect of that relationship holds quite robustly: variations in profit margins are essentially a mirror-image of the combined deficit of households and government. This is true not only of levels, but of point-to-point changes. Corporate profit margins will contract as the combined deficit of households and government retreats (even moderately) from the record levels of recent years. The impression that stocks are “reasonably valued” relative to earnings is an illusion driven by profit margins that are 70% above their historical norm. See Taking Distortion at Face Value to review the accounting relationships here.
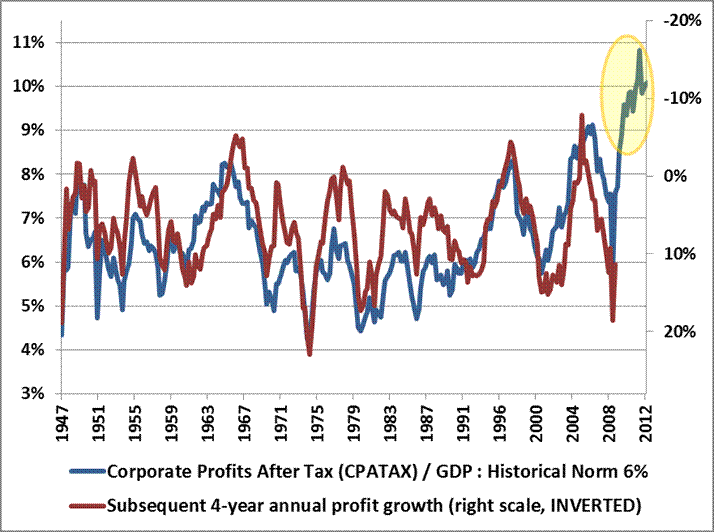
Almost universally, Wall Street analysts are making the mistake of valuing stocks on the basis of a single year of forward operating earnings, as if the present estimate is a sufficient statistic that is representative of the entire future stream of cash flows. Even profit/GDP shares much less extreme than today’s have always been followed by a contraction of profits over the following 4-year period.
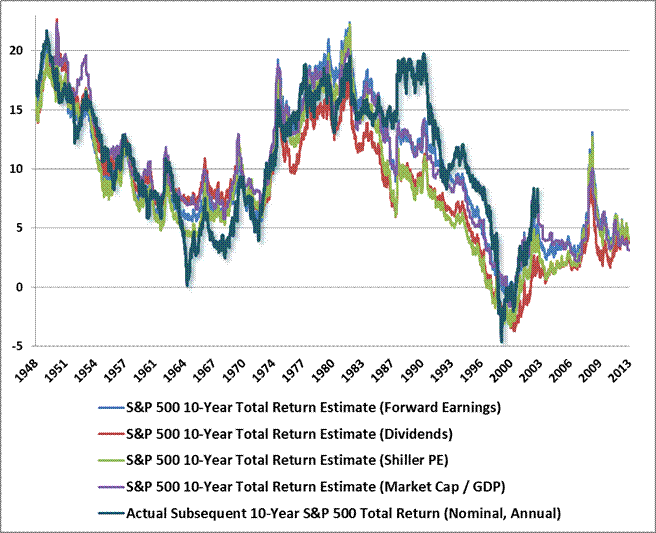
On valuations We presently estimate the likely return of the S&P 500 over the coming decade to be about 3.2% annually. There are all sorts of models that Wall Street wishes investors to embrace. Embrace the ones that show a long-term, demonstrated relationship with actual subsequent market returns, both historically and even over the period since 2000. See Investment, Speculation, Valuation and Tinker Bell to review the estimation methods here.
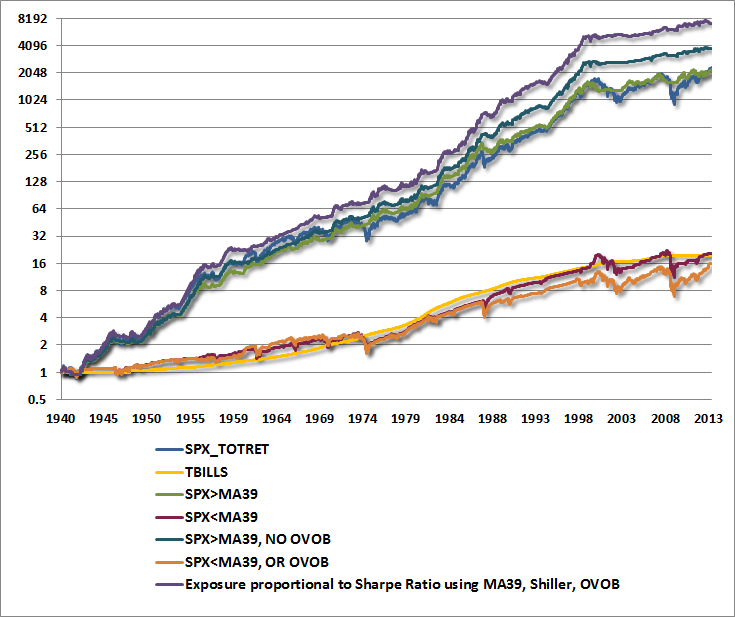
On trend-following Trend-following measures can be enormously helpful for investors, particularly for risk-management, and particularly in the absence of overvalued, overbullish investment conditions. In the presence of such overextended conditions, the overvalued, overbullish (OVOB) features of the market have historically dominated, on average. Points where those overextended conditions have been cleared, provided that trend-following measures are favorable (or turn favorable), are where the better investment opportunities have typically emerged, particularly when valuations have been favorable as well. See Aligning Investment Exposure With the Expected Return/Risk Profile to review the effect of these considerations, as illustrated below.
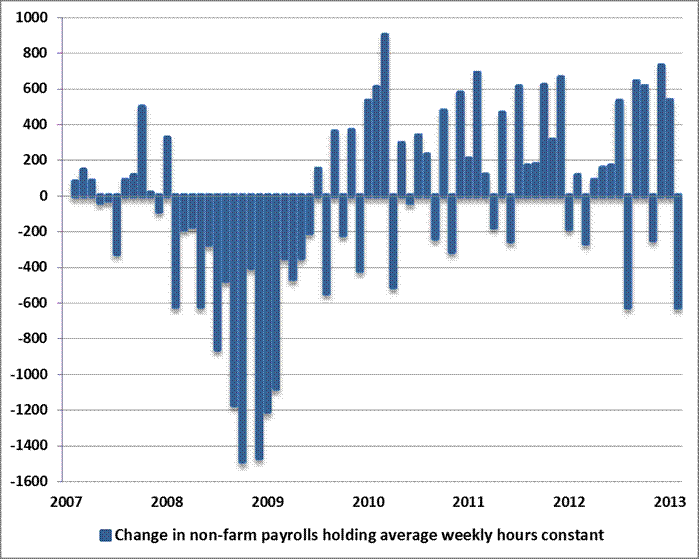
On the economy Successive bouts of quantitative easing have clearly been successful at suppressing periodic spikes in risk premiums, and have been at effective enough to release a few months of pent-up demand, in an amount sufficient to move an economy repeatedly from the border between expansion and recession, but only for a few months each time. However, Europe has now entered a clear recession, with much of the developed world following suit. Real GDP growth and real final sales have both dropped from year-over-year growth rates above 2% to below 1.9% - a combined occurrence that has rarely emerged except during or immediately prior to recessions. Regional purchasing managers surveys and Federal Reserve surveys have turned uniformly lower in recent reports. Importantly, while non-farm payroll growth was surprisingly robust in April, the gain belied a significant decline in the average hourly workweek. It is the combination of workers and hours worked that determines production and income. If labor hours were held constant, total non-farm payrolls would have declined between 550,000 and 623,000 jobs in April (depending on whether one uses non-farm payrolls x average weekly hours or instead uses the index of aggregate weekly hours). The U.S. may or may not avoid recession, but there is no evidence of a material or durable acceleration in economic growth here. As a simple rule of thumb, I would suggest watching for a spike, sustained over at least a few months, in the Philly Fed index and the new orders component of the Chicago Purchasing Managers Index. We observe nothing of the sort at present.
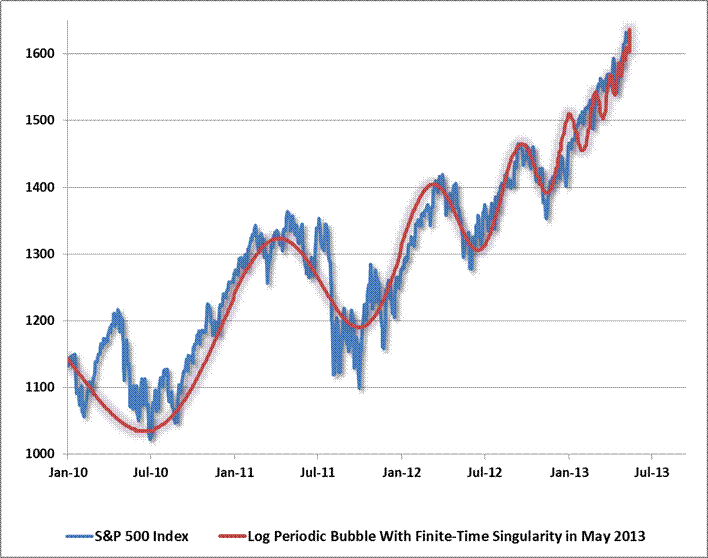
On bubbles While I certainly don’t believe that markets have to obey math, it’s very clear that investors have taken on a very familiar pattern of what I’ve called “increasingly immediate impulses to buy the dip” and what physicist Didier Sornette would call a “log-periodic bubble.” That constant and more immediate tendency to buy dips is a signature that is difficult to entirely dismiss. In itself, it doesn’t always lead to unfortunate outcomes, but in the context of rich valuations, overbullish sentiment, and global economic headwinds, it is worth monitoring. As Barron’s Magazine noted in early 1969, just before the market lost a third of its value in the 1969-1970 plunge: “The failure of the general market to decline during the past year despite its obvious vulnerability, as well as the emergence of new investment characteristics, has caused investors to believe that the U.S. has entered a new investment era to which the old guidelines no longer apply. Many have now come to believe that market risk is no longer a realistic consideration, while the risk of being underinvested or in cash and missing opportunities exceeds any other.” Defining the precise date where a “finite-time singuarlity” occurs is difficult to pinpoint in real-time, but I should note that to remain consistent with a Sornette-type bubble, it’s difficult to push the singularity past this month. Again, that doesn’t mean that the market has to conform to the mathematics of a log-periodic bubble here, but the precision of this pattern in recent years is creepy enough to be notable.
Again, even if the recent bull market has much further to go, I would expect that we’ll observe one or more points where a moderate retreat from overvalued, overbought, overbullish conditions is joined with an early improvement (or lack of clear deterioration) in trend-following measures. We’ve certainly adapted our own criteria and methods enough to allow a constructive response even if valuations remain generally rich. Though the market has showed few cyclical fluctuations in recent quarters, the market has ultimately never failed to move in cycles. The points that investors have forgotten that markets move in cycles are the points where they have been most vulnerable. Present conditions are the wrong point to initiate a substantial exposure to market risk. Nothing further, your honor. I am resting my case. In Memory of Alan Abelson For more than 30 years, I’ve started my weekend reading the latest letter from a friend. Alan Abelson was an editor of Barron’s Magazine, and wrote its leading column “Up and Down Wall Street” for nearly half a century. I only knew Alan personally from a handful of enjoyable conversations over two decades – but his writing always made me feel that an old friend was sitting down to share what he had seen over the latest week, and the stories he had heard. Alan wasn’t just an insightful financial journalist; he was a wonderful writer who would treat his readers to interesting anecdotes, imagery, and playful turns of phrases. He didn’t try to sell you an opinion – he would share what he saw; bring you in as a guest among a whole circle of characters that he knew. Over the years, I felt graced to be among those subjects, with introductions ranging everywhere from lighthearted (“chief cook and bottle-washer”) to generous. You could hardly read a sentence from his hand without noticing the twinkle in his eye. When he wrote about himself, Alan always used the royal “we.” He deserved to do that – he was a king. Thank you, Alan. I’ll miss you very much. I’ve no doubt that the wisdom, humor, insight, and joy of writing that you’ve shared with your readers have also become part of your heaven. The foregoing comments represent the general investment analysis and economic views of the Advisor, and are provided solely for the purpose of information, instruction and discourse. Only comments in the Fund Notes section relate specifically to the Hussman Funds and the investment positions of the Funds. Fund Notes As of last week, the market environment remained characterized by an overvalued, overbought, overbullish, rising-yield environment that is places present conditions in the singularly most negative such syndrome we define. See Capitulation Everywhere for a review of these conditions. At the same time, we’ve done a great deal of what we call “exclusion analysis” to narrow the set of periods when the average return/risk profile of the market is negative to a smaller set that captures the worst of those outcomes, freeing the remaining set of instances for a more constructive investment stance. Generally speaking, the distinction comes down to trend-following and momentum considerations on one hand, and overvalued, overbought, overbullish syndromes on the other. In the absence of those extreme syndromes, favorable trend-following measures are generally enough to warrant some amount of constructive exposure even when valuations are rich. In the presence of those extreme syndromes, the choice is no longer between defensive and constructive, but between levels of defensiveness (matched-strike hedges versus staggered-strike hedges, for example). In general, those distinctions come down not just to trend-following measures (the “slope” of price movements), but to momentum measures (their “acceleration”) as well. Presently, Strategic Growth Fund is fully hedged, with a “staggered strike” position that raises the strike prices of the index put option side of our hedge, but we continue to keep those strike prices several percent below current market levels, while relatively low implied volatility has reduced the premium cost of these options. As a result, most of the day-to-day movement in the Fund can actually be traced to differences in the performance of the stocks held by the Fund and the indices we use to hedge. If the present bull market has far to go, I expect that we will observe several opportunities where overextended syndromes are absent and favorable trend-following measures are present. In a richly valued market, we view those points as the most reasonable ones to accept market exposure. Meanwhile, Strategic International remains fully hedged. Strategic Dividend Value is hedged at about 50% of the value of its stock holdings, and Strategic Total Return continues to have a duration of about 3 years (meaning that a 100 basis-point move in interest rates would be expected to impact Fund value by about 3% on the basis of bond price fluctuations), with about 14% of assets in precious metals shares. --- The foregoing comments represent the general investment analysis and economic views of the Advisor, and are provided solely for the purpose of information, instruction and discourse. Prospectuses for the Hussman Strategic Growth Fund, the Hussman Strategic Total Return Fund, the Hussman Strategic International Fund, and the Hussman Strategic Dividend Value Fund, as well as Fund reports and other information, are available by clicking "The Funds" menu button from any page of this website. |
|||||||||||||||||||||||||
|
For more information about investing in the Hussman Funds, please call us at
1-800-HUSSMAN (1-800-487-7626) 513-326-3551 outside the United States Site and site contents © copyright Hussman Funds. Brief quotations including attribution and a direct link to this site (www.hussmanfunds.com) are authorized. All other rights reserved and actively enforced. Extensive or unattributed reproduction of text or research findings are violations of copyright law. Site design by 1WebsiteDesigners. |