|
|
||||||
|
|

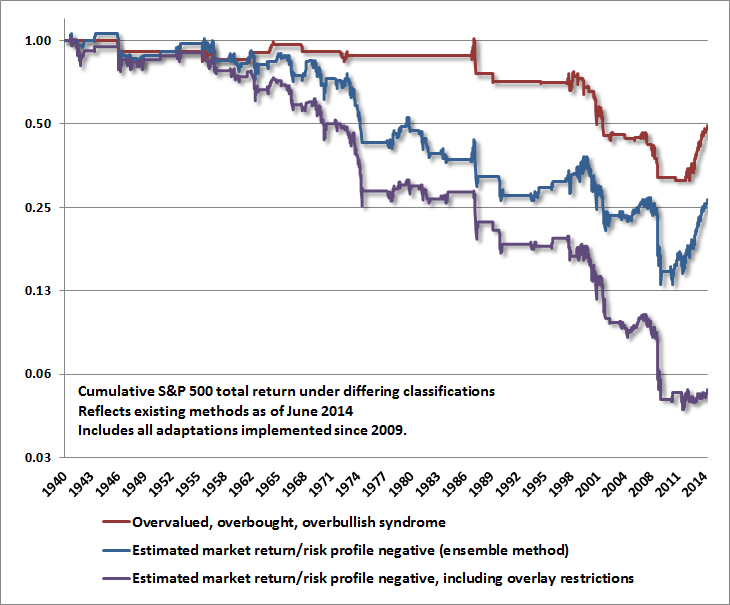
June 16, 2014 Formula for Market Extremes Market extremes generally share a common formula. One part reality is blended with one part misguided perception (typically extrapolating recent trends as if they are driven by some reliable and permanent mechanism), and often one part pure delusion (typically in the form of a colorful hallucination with elves, gnomes and dancing mushrooms all singing in harmony that reliable valuation measures no longer matter). The technology bubble was grounded in legitimate realities including the emergence of the internet and a Great Moderation of stable GDP growth and contained inflation. But it also created a misperception that it was possible for an industry to achieve profits while having zero barriers to entry at the same time (the end of that misperception is why the dot-com bubble collapsed), a misperception that technology earnings would grow exponentially and were not cyclical (as we correctly argued in 2000 they would shortly prove to be), and the outright delusion that historically reliable valuation measures were no longer informative. Meanwhile, the same valuation measures we use today were projecting – in real time – negative 10-year nominal total returns for the S&P 500 over the coming decade, even under optimistic assumptions (see our August 2000 research letter). The housing bubble was grounded in legitimate realities including a boom in residential housing construction and a legitimate economic recovery that followed the 2000-2002 bear market (which we responded to by shifting to a constructive stance in April 2003 despite valuations still being elevated on a historical basis). But the housing bubble also created a misperception that mortgage-backed securities were safe because housing prices had, at least to that point, never experienced a major collapse. The delusion was that housing was a sound investment at any price. The same delusion spread to the equity markets, helped by Fed-induced yield-seeking speculation by investors who were starved for safe return. Meanwhile, the same equity valuation measures we use today helped us to correctly warn investors of oncoming financial risks at the 2007 peak (see A Who’s Who of Awful Times to Invest). The 2008 credit crisis, which we anticipated, was more challenging for us because the extent of employment losses and gravity of asset price collapse was greater than we had observed in the post-war data that underpinned our methods of assessing the market return/risk profile. Our valuation methods didn’t miss a beat, and correctly identified a shift to undervaluation after the late-2008 market plunge (see Why Warren Buffett is Right and Why Nobody Cares). But examining similar periods outside of post-war data, we found that measures of market action that were quite reliable in post-war data were heavily whipsawed in the Depression, and even the valuations we observed at the 2009 market lows were followed, in the Depression, by an additional loss of two-thirds of the market’s value. My resulting insistence on ensuring our methods were robust to that “two data sets” problem was necessary, but the timing could hardly have been worse, with an initial miss in the interim of that stress-testing, and an awkward transition to our present methods of classifying return/risk profiles. The present market environment is grounded in the legitimate reality that the labor market has recovered its losses, but not to the extent that creates resource constraints or clear interest rate pressures. Though broad measures of economic activity have actually eased to year-over-year levels slightly below those that have historically distinguished expansions from recessions, the economy seems to be treading water, and don’t observe a particularly negative tone. Still, the recent period has created a misperception that monetary easing itself will support financial markets regardless of their valuation. The error here is that we know from history that it does not. Indeed, the 2000-2002 and 2007-2009 collapses both progressed in an environment of aggressive and sustained monetary easing. What’s actually true about monetary policy is that zero-interest rate policy has created a perception that investors have no alternative but to “reach for yield” in riskier assets. It’s entirely that reach for yield that investors must rely on continuing indefinitely, because there’s no mechanistic cause-effect relationship between the Fed balance sheet and stock prices, bank lending, or economic activity. As usual, the delusion is that this Fed-induced reach for yield is enough to make equities a sound investment at any price. Ironically, the Fed itself is in the process of reversing course on this policy. Meanwhile, based on the same valuation methods that correctly projected negative 10-year returns at the 2000 peak, correctly gave us room to shift to a constructive position in early 2003, correctly helped us warn of severe market losses at the 2007 peak, and correctly identified the shift to market undervaluation in late-2008 (which those who don’t understand our stress-testing narrative may not recognize), we currently estimate prospective S&P 500 nominal total returns of just 2% annually over the coming decade, and negative returns on every horizon shorter than about 7 years. In short, investors who are reaching for yield in stocks as an alternative to risk-free assets are most likely reaching for a negative total return in stocks between now and about 2021. Lessons from the recent half-cycle The half-cycle since 2009 has certainly challenged our reputation in recent years, but it has not challenged our confidence about the future a bit. To understand that, it may be helpful to look under the hood at what has been different about this period. I’ve discussed the impact of my 2009 stress-testing decision in prior comments (see Setting the Record Straight), but I’m not sure that I’ve been clear about what has legitimately been “different” about the recent half-cycle compared with historical market cycles, and how we’ve adapted to that. The chart below may be helpful in that regard. Each line shows the cumulative total return of the S&P 500 Index under a variety of conditions we identify. The chart is presented on log-scale. Moving higher by one horizontal line represents a doubling. Moving lower by one horizontal line represents a 50% loss. I presented a similar chart last September (see The Lesson of the Coming Decade), but log-scale gives a much more obvious picture of what’s been so challenging in the past few years. That challenge should immediately be evident in the red line. In market cycles across history, a syndrome of overvalued, overbought, overbullish conditions has historically been resolved by market losses fairly quickly (though in the 1987 case, you’ll notice a spike higher before the market gave back all of those gains even before exiting from the syndrome). I should also emphasize that the market often falls much further even after the original syndromes are "cleared" by an initial decline (most notably in '73-74, '87, '00, and '07), but that further downside risk is typically captured by other factors. In the recent cycle, however, overvalued, overbought, overbullish conditions have been pushed to increasingly greater severity without resolution. In my view, this is likely to make the ultimate consequences that much worse, but the persistence of these conditions has clearly been a surprise relative to all historical experience.
When we addressed our “two data sets problem” in 2010 by introducing ensemble methods, those methods clearly picked up the historical regularity that overvalued, overbought, overbullish syndromes are generally followed by falling equity prices. The same regularity is clearly evident in pre-1940 data, though sentiment has to be imputed. If we examine the cumulative return of the S&P 500 in periods when the estimated market return/risk profile was negative based on these ensemble methods (blue line), we do observe some periods when the S&P 500 temporarily advanced to further highs before retreating (including the usual suspects – 1987, the late-1990’s, and the advance to the 2007 peak). Still, the persistence of yield-seeking speculation and increasingly extreme overvalued, overbought, overbullish conditions has been unequalled in this cycle, and we had to find ways to adapt. During the late-1990’s, observing that stock prices were persistently advancing despite historically overvalued conditions, we introduced a set of “overlays” that restricted our defensive response to overvalued conditions, provided that certain observable supports were present. These generally related to features of market action that I called “trend uniformity.” Though the ensemble approach we introduced in 2010 was more effective in classifying market return/risk profiles than every other method we’ve examined, similar overlays were required to restrict the response to overvalued, overbought, overbullish conditions. In identifying proper restrictions, the best practice is that a) they should not contradict historical evidence, and b) they should testably result in improved discrimination of subsequent market return and risk, not only in the most recent cycle, but in prior historical cycles and in “holdout” validation data not used in the design of those restrictions. For example, imposing a restriction that amounts to “Don’t fight the Fed” contradicts historical evidence because there are too many periods across history, most recently the 2000-2002 and 2007-2009 plunges, when the Federal Reserve was persistently and aggressively easing policy but stocks experienced profound losses anyway (see Following the Fed to 50% Flops). Imposing a restriction that amounts to “Don’t fight an expanding Fed balance sheet” also contradicts the evidence. A restriction that amounts to “Don’t fight quantitative easing” is arbitrary because it can’t be tested in historical data prior the recent cycle, and so on. As it happens, the most reliable and testable restrictions have a great deal to do with market internals, price behavior, and interest rates, but they are far less general than investors seem to believe. Aphorisms about not fighting the tape or not fighting the Fed aren’t really bad advice, particularly in combination. But they are certainly weaker advice over historical market cycles than investors seem to imagine. The purple line in the chart above restricts the performance of the S&P 500 to periods with a negative estimated market return/risk profile (technically, a negative Sharpe ratio – see Aligning Market Exposure with the Expected Return/Risk Profile), but that also survive those overlay restrictions relating to market internals, interest rates, price behavior, and the severity of overvalued, overbought, overbullish conditions. The upshot is not only that I believe we’ve addressed the central challenges we’ve encountered in the half-cycle since 2009, but equally important, I view it as profoundly misguided to ignore present overvalued, overbought, overbullish extremes simply because they have not yet demonstrated their consequences. It’s certainly possible that market conditions could shift in a way that eases our immediate concerns, and of course, a material retreat in valuations coupled with an early improvement in market internals would encourage a much more constructive shift. Presently, speculators (I hesitate to call them investors at these valuations) are sitting on that purple line, expecting that the next move will be higher. They may be fortunate enough to be right, but for our part, history is brutal to that expectation, and we’re confident that patient and historically-informed discipline, coupled with the willingness to address difficulties through research, is the more sound approach. The foregoing comments represent the general investment analysis and economic views of the Advisor, and are provided solely for the purpose of information, instruction and discourse. Only comments in the Fund Notes section relate specifically to the Hussman Funds and the investment positions of the Funds. Fund Notes The Hussman Funds presently maintain a defensive stance toward equities, a relatively neutral stance toward Treasury debt, and a moderately constructive stance toward precious metals shares. --- The foregoing comments represent the general investment analysis and economic views of the Advisor, and are provided solely for the purpose of information, instruction and discourse. Prospectuses for the Hussman Strategic Growth Fund, the Hussman Strategic Total Return Fund, the Hussman Strategic International Fund, and the Hussman Strategic Dividend Value Fund, as well as Fund reports and other information, are available by clicking "The Funds" menu button from any page of this website. |
|||||||||||||||||||||||||
|
For more information about investing in the Hussman Funds, please call us at
1-800-HUSSMAN (1-800-487-7626) 513-326-3551 outside the United States Site and site contents © copyright Hussman Funds. Brief quotations including attribution and a direct link to this site (www.hussmanfunds.com) are authorized. All other rights reserved and actively enforced. Extensive or unattributed reproduction of text or research findings are violations of copyright law. Site design by 1WebsiteDesigners. |