 July 14, 2014
Ockham's Razor and the Market Cycle
John P. Hussman, Ph.D.
All rights reserved and actively enforced.
Reprint Policy
Ockham’s razor is a principle that states that among various hypotheses that might be used to explain a set of observations, the hypothesis – consistent with the evidence – that relies on the smallest number of assumptions is generally preferred. Essentially, the razor shaves away what is unnecessary and retains the most compact explanation that is consistent with the data. The same basic principle runs through the history of thought from Ptolemy (“We consider it a good principle to explain the phenomena by the simplest hypothesis possible”) to Einstein (“A theory should be made as simple as possible, but not so simple that it does not conform to reality”).
Suppose, for example, that one periodically sets hot cherry pies near the window to cool, and sometimes they disappear, with an empty pie tin usually later found in the kids’ treehouse, and cherry stains around their lips. When pies go missing, one would normally not assume that aliens had come down to earth, taken the pie, devoured it in mid-air, brushed by the kids’ lips leaving cherry stains in the process, erased the kids’ memory, discarded the tin in the treehouse, and then returned to Xenon.
When we observe the increasingly tortured arguments that “this time is different,” we see investors discarding straightforward explanations that are fully consistent with the evidence and opting instead for the aliens-from-Xenon theory.
Valuations
Let’s start with valuations and expected long-term returns. For well over a quarter of a century, I've used the same essential set of calculations to project long-term returns for the S&P 500, typically on horizons of 7-10 years. These models are not “back-fitted” to the data, but are instead straightforward arithmetic. Let’s do that arithmetic. If math makes your head hurt, just skim through what follows till the pain stops:
Price = Price
Price = Fundamental * Price/Fundamental
Price_future = Fundamental_future * Price_future/Fundamental_future
Price_today = Fundamental_today * Price_today/Fundamental_today
Price_future/Price_today =
Fundamental_future/Fundamental_today * (P/F_future / P/F_today)
Note that this holds regardless of what fundamental we use, but ideally, we would like to use some fundamental that is relatively smooth, so that the growth rate of that fundamental is not highly volatile over time. Notice also that what we have here is a mathematical identity, which can also be written in terms of annual returns and growth rates. Observe that:
Expected annual capital gain = {Price future / Price_today}^(1/T) – 1
where T is some number of years into the future. Similarly:
Annual growth of the fundamental = {Fundamental_future/Fundamental_today}^(1/T) – 1
Writing the expected annual growth rate of the smooth fundamental as “g”, we can combine all of this to:
Expected annual capital gain = (1+g) * [P/F_future / P/F_today]^(1/T) – 1
Now for total returns, one needs to include dividend income. A rough estimate of that is simply to add in the current dividend yield. But given that the price/fundamental ratio may change over time, and that dividends are likely to grow roughly alongside other smooth fundamentals, a better estimate of average dividend income over time is the average of the current dividend yield and the yield that is likely to prevail at the expected future price/fundamental ratio. I trust it’s easy enough to demonstrate that this works out to:
Expected dividend income = dividend yield * (1 + P/F_today / P/F_future)/2
So it’s a mathematical identity and an implication of basic arithmetic that one can estimate the T-year nominal total return of stocks as:
Expected annual total return =
(1+g)*[P/F_future / P/F_today]^(1/T) + dividend yield * (1 + P/F_today / P/F_future)/2 – 1
Again, it’s helpful to use smooth fundamentals that have relatively stable growth rates over time, and where the price/fundamental ratio tends to mean revert. As I demonstrated in my Wine Country Conference talk, Very Mean Reversion, the proper test of mean reversion is not whether the P/F ratio itself “looks” like it mean reverts. Rather, the proper test of mean reversion is actually whether the log(P/F) ratio is inversely correlated with the actual subsequent percentage change in price.
For practical purposes, the most accurate horizon for these estimates is about 1.5 market cycles (again, see the WCC talk to understand why), which works out to a 7-10 year horizon. The best choice for "P/F_future" on this horizon is the norm that is associated with reasonably normal market returns (using the pre-bubble average works well, but the overall calculation can be done repeatedly for various assumptions, as we typically do in practice. See my calculations in 2000 for example). As for g, growth in nominal GDP, corporate revenues, and corporate earnings in the U.S. is quite stable at about 6% annually from peak-to-peak across economic cycles - regardless of the rate of inflation (there are economic reasons for this relating to the exchange equation MV = PY, which implies %P = %M + %V - %Y and is reflected empirically in a tendency for real growth and inflation to be negatively correlated, but I'll leave more equations for another time).
The upshot is that given a reasonable projected growth rate g for some smooth fundamental, and a reasonable assumption about the future price/fundamental ratio, one can estimate the long-term expected return that is consistent with current price levels. Not with back-fitting, but with straightforward arithmetic. Notice that if the fundamental enjoys a surprising “error” by growing faster than expected over the T-year period, it’s also likely that the future price/fundamental ratio at the end of T years will be lower than one would have expected. The fact that these “errors” offset in a way that preserves overall accuracy should not be surprising.
For numerous smooth fundamentals, including the Shiller CAPE (S&P 500 / 10-year smoothed inflation-adjusted earnings), S&P price/revenue, and even market capitalization / nominal GDP, this relationship has provided clear guidance about expected market returns across a century of market history, and has not failed at all even in recent decades.
It’s certainly possible to turn this into a “real” model by introducing additional assumptions about future inflation, but one can easily show that inflation works its way through the arithmetic so that the expected real return is simply the expected nominal return as calculated above, minus whatever inflation figure one might have assumed. Whether one discounts nominal fundamentals with a nominal discount rate or real fundamentals with a real discount rate, one obtains the same price/fundamental ratio.
The fact is that we continue to use the same market valuation approaches that I’ve used for more than a quarter of a century in real time. These are not the objects of back-testing. They are simply objects of basic arithmetic. These methods allowed us to correctly advise a fully leveraged investment stance in the early 1990’s, correctly estimated a decade of negative total returns for the S&P 500 in 2000 even under optimistic assumptions, indicated a sufficient improvement by early-2003 to allow us to advise a strongly constructive position at the beginning of that bull market (saying “we have no evidence to hold anything but a constructive position”), warned of dangerous overvaluation in 2007 before the market lost more than half its value, correctly indicated undervaluation in late-2008 and early 2009 as I noted in real-time (our challenges in the recent half cycle had nothing to do with our valuation methods), and presently estimate negative returns for the S&P 500 on every horizon shorter than 8 years. The chart below presents several variants of this valuation approach (based on data from Standard & Poors, the Federal Reserve, and Robert Shiller), with estimated and actual subsequent S&P 500 annual nominal total returns measured on the left scale.
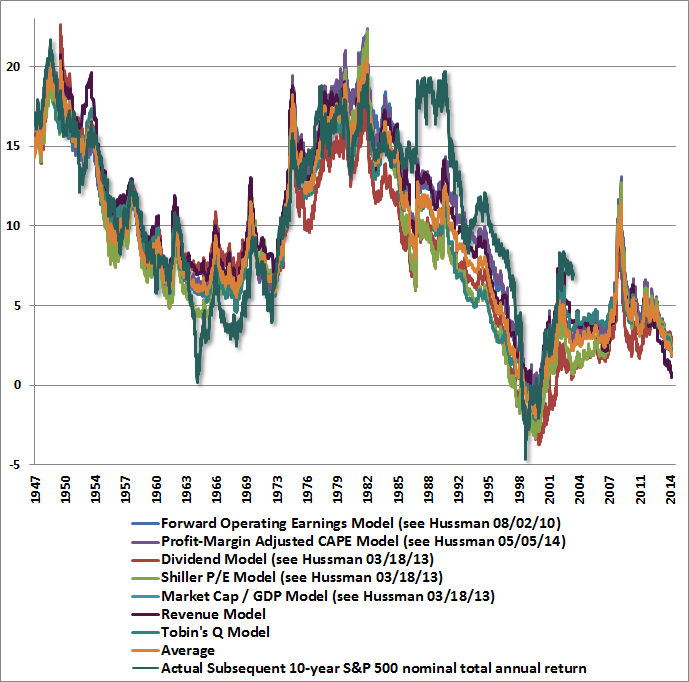
Ockham’s razor is very straightforward here. As much as investors seem to want to believe that aliens from Xenon have brought some brave new world, our valuation approach is consistent with a century of market history and has not missed a beat even in recent market cycles. We continue to view long-term prospects for the stock market as dismal at present valuations.
Ockham’s razor and the half-cycle since 2009
What then, is one to make of the challenges we’ve experienced in the half-cycle since 2009, after coming through so strongly in previous complete market cycles? There are several possibilities. One is the explanation that is consistent with everything I’ve written and all that has occurred in real-time during this half-cycle: that I insisted on stress-testing our methods against Depression-era outcomes in a fiduciary decision that I made – in hindsight – at the worst possible time, that we missed a strong market rebound in the interim of addressing that “two-data sets problem,” that we did encounter a truly “different” element in the current cycle to the extent that severely overvalued, overbought, overbullish conditions have persisted much longer than has historically been the case – primarily because of Fed-induced yield seeking, that we believe the severe consequences of these extremes have merely been deferred rather than avoided, and that while we do remain defensive here because of how extreme and uncorrected conditions have become, I also strongly believe that we’ve adapted to the potential for these speculative, yield-seeking episodes without the likelihood of similar challenges in future cycles.
An alternative explanation for our challenges in this half-cycle is that I’m simply a permabear. But that’s harder to square with my being a fully-leveraged “lonely raging bull” in the early 1990’s, or with our strongly constructive shift (despite valuations that were still elevated relative to historical norms) in early 2003 as a new bull market was taking hold, and is also inconsistent with our similarly constructive shift after the market plunge in 2008. I’ve consistently observed that the strongest return/risk profiles are associated with at least a moderate retreat in valuations coupled with an early improvement in market action. Indeed, I observed the same thing in late-2008 (see Why Warren Buffett is Right and Why Nobody Cares). The challenge in the half-cycle since 2009 is that when we examined measures of “early improvement” that were quite effective in post-war data, they were much more vulnerable to whipsaws and large interim losses in Depression-era data, and coupled with economic and financial collapse that was “out of sample” from a post-war perspective, I felt a fiduciary duty to stress test our methods. We have every expectation of shifting our investment stance in response to evidence of a favorable shift in the market return/risk profile, and we have every reason to expect that the completion of the present market cycle will provide that opportunity at significantly lower levels than we presently observe.
It’s easier to assume that I have a permabearish outlook on the market, and until we demonstrate otherwise, it’s reasonable to wonder whether we’ll maintain our tendency of being early at market peaks (my expectation is yes, somewhat, but far less in coming cycles than one would infer from pre-crash bubbles in recent memory). Broadly speaking though, the permabear hypothesis is inconsistent with the evidence. As Einstein said, a theory should not be so simple that it does not conform to reality. We’ve extensively discussed why challenges emerged in this half-cycle. We’ve detailed what we’ve done to address them. I have greater confidence about our approach than at any time in the decades I’ve been in this profession. But people can believe what they wish. We don’t have any interest in drawing investors to our case, or in urging investors to sell the market, as someone else would have to hold stocks at these prices regardless. We’ve never had a marketing or advertising department. We’re content to articulate and adhere to our discipline for those who find or expect those efforts to be useful, without any expectation of changing anyone else’s mind. Maybe I’m the only guy left who isn’t willing to abandon the lessons of history to “get in on this.” Then again, maybe when a lopsided majority thinks the same thing about the market, it’s time to think for yourself.
We increasingly see investors believing that history is no longer informative, and that the Federal Reserve has finally discovered how to produce perpetually rising markets and can intervene without consequence to support the markets and the economy indefinitely. Maybe it’s no longer true that valuations are related to subsequent returns. Maybe, contrary to all historical experience, reliable measures of valuation that have had a 90% correlation with actual subsequent market returns can now remain at double their historical norms forever, thereby allowing capital gains to be unhindered by any future retreat in valuation multiples as fundamentals grow over time. It’s just that one must also rely on valuations never retreating, because even if earnings grow at 6% annually indefinitely, and the CAPE simply touches a historically-normal level of 16 even 20 years from today, the total return on stocks, including dividends, would still be expected to average only 5% annually over that horizon. That’s just arithmetic.
Investors should also note the following. At present, the most historically reliable valuation measures average more than 110% above their pre-bubble historical norms. Secular bear market lows don’t occur very often, but when they do, valuations typically average about 50% of pre-bubble norms. Here’s some arithmetic. Assuming constant 6% annual growth in nominal fundamentals, if the stock market was to experience a secular bear market low 25 years from now, the S&P 500 Index would be unchanged from present levels. Checking those numbers is good practice [1.06 * (0.5/2.1)^(1/25) = 1.00]. Market valuations leave no margin for error, even over the long-term.
Meanwhile, nothing even in recent market cycles provides any support to the assumption of permanently elevated valuations. The only support for it is the desire of investors to avoid contemplating outcomes the same as the market suffered the last two times around. “This time is different” requires a lot of counterfactual assumptions. Ockham’s razor would suggest a nice shave.
On the circular relationship between valuation and expected return
For any given set of expected future cash flows, there is a circularity: you tell me the price, and I can tell you the long-term return you can expect over time. Conversely, you tell me the long-term return you want to achieve, and I can tell you the price that would be consistent with that expected return. In other words, there is a direct arithmetic mapping from price to expected return and vice versa.
A widespread misunderstanding comes in when people start using the phrase “fair value.” For any given set of expected future cash flows, if you tell me the price, I can tell you the long-term return, period. If you tell me the long-term return, I can tell you the price, period. Nothing changes this. If you want to say that lower interest rates “justify” a low expected return, and therefore justify a higher price, that’s fine. Just understand that the low expected return will still follow that higher price. If you want to say that in a zero interest rate world, stocks should be priced for zero expected returns over the next 8 years, I have no problem with the conclusion that under that assumption, stocks are at “fair value” here. Just understand that under that conception of “fair value” stocks can still be expected to return nothing over the next 8 years. What is emphatically not true, and not mathematically consistent, is to say that low interest rates “justify” a low expected return, and therefore justify a higher price, but then to turn around and say that since stocks are “fairly valued” under that assumption, they can be expected to achieve normal returns in the future.
For that reason, we are much more comfortable estimating long-term total returns directly, rather than converting them to a price that we think is “fair.” The “fair” price always embeds some assumption about future returns, and investors may very well differ on what is fair. Frankly, if you think that an asset class that is quite capable of repeatedly losing half of its value should compensate for that risk with historically normal total returns of about 10% annually over time, I would tell you that “fair value” is about 950 on the S&P 500.
While every bear market in history except the October 2002 market low brought our estimates of prospective 10-year nominal returns above 10% annually, I have no particular expectation that the present market cycle won’t be like the 2000-2002 instance and end without bringing valuations to that level. As always, the strongest estimated return/risk profiles emerge when a material retreat in valuations is coupled with an early improvement in market action. There is no requirement that stocks must retreat anywhere near historical norms over the completion of the present market cycle. Nor, of course, can we rule out a substantial move below those norms, which has regularly occurred throughout history, including the period prior to the 1960’s despite interest rates that were quite low. We’ll respond to the evidence as it emerges.
The foregoing comments represent the general investment analysis and economic views of the Advisor, and are provided solely for the purpose of information, instruction and discourse. Only comments in the Fund Notes section relate specifically to the Hussman Funds and the investment positions of the Funds.
Fund Notes
The Hussman Funds continue to maintain a defensive stance toward equities and Treasury bonds, with a constructive stance toward precious metals shares.
---
The foregoing comments represent the general investment analysis and economic views of the Advisor, and are provided solely for the purpose of information, instruction and discourse.
Prospectuses for the Hussman Strategic Growth Fund, the Hussman Strategic Total Return Fund, the Hussman Strategic International Fund, and the Hussman Strategic Dividend Value Fund, as well as Fund reports and other information, are available by clicking "The Funds" menu button from any page of this website.
Estimates of prospective return and risk for equities, bonds, and other financial markets are forward-looking statements based the analysis and reasonable beliefs of Hussman Strategic Advisors. They are not a guarantee of future performance, and are not indicative of the prospective returns of any of the Hussman Funds. Actual returns may differ substantially from the estimates provided. Estimates of prospective long-term returns for the S&P 500 reflect our standard valuation methodology, focusing on the relationship between current market prices and earnings, dividends and other fundamentals, adjusted for variability over the economic cycle (see for example Investment, Speculation, Valuation, and Tinker Bell, The Likely Range of Market Returns in the Coming Decade and Valuing the S&P 500 Using Forward Operating Earnings ).