|
|
||||||
|
|

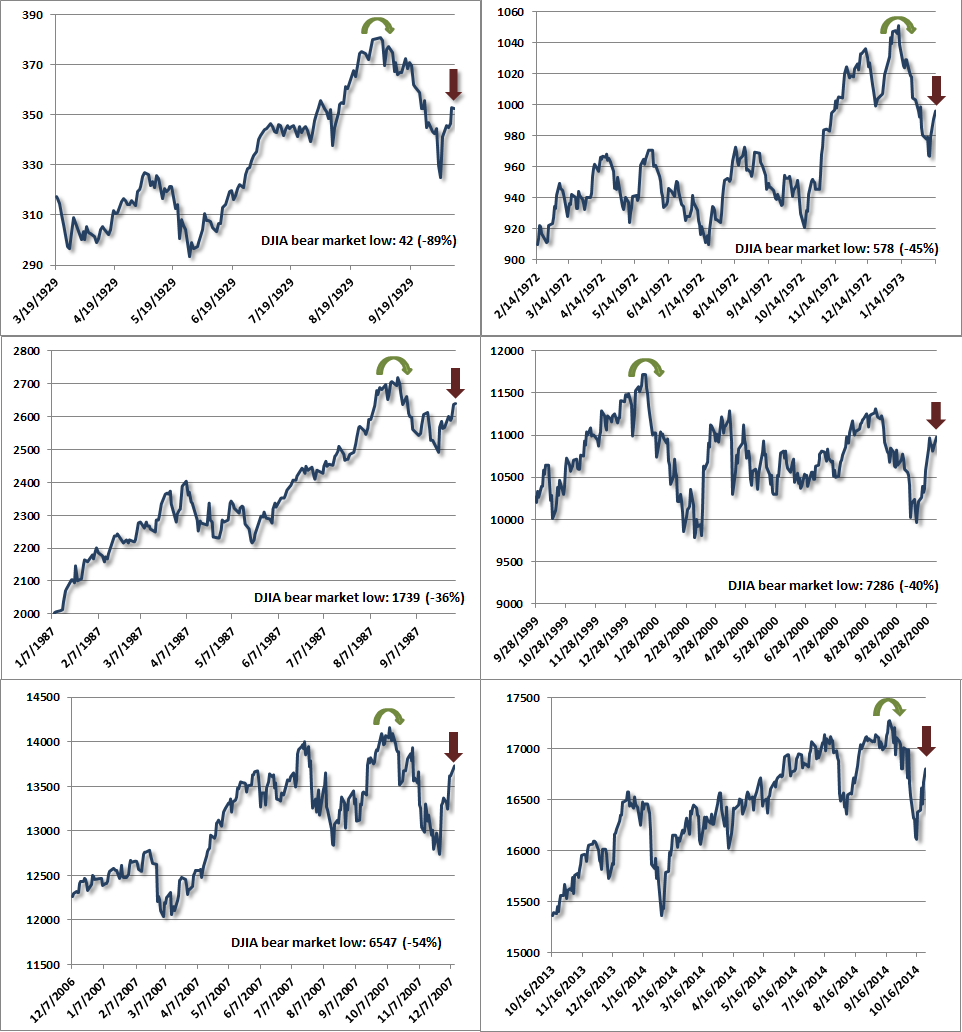
October 27, 2014 Fast, Furious and Prone to Failure “The Market Climate remains on a Crash Warning... but we have to allow for the possibility of the usual fast, furious bear market rallies that can occur after the market becomes oversold. In short, near term direction is a coin toss, but the next few days could involve a sizeable move one way or another. Overall, our position remains defensive, but we're managing our risks in a way that accommodates the possibility of a bounce. It's unfortunate, in my view, that investors have so much faith that a monetary easing can and will bail out the economy and the stock market. My view is fairly simple - the economic boom we've enjoyed has been driven by an inordinate amount of leverage, much of it of very poor credit quality, and by capital spending financed through the import of foreign savings. In an environment where demand for new capital investment was strong, easy bank credit and ample foreign savings fed extremely good economic growth rates. But I believe we are past that point here.” Hussman Weekly Market Comment (link) December 19, 2000 “The market weakness we've observed since last year has been fairly tame in the sense that the S&P 500 has to-date suffered a fraction of the loss that we typically observe in a standard, run-of-the-mill bear. It can be dangerous to attempt trading bear market rallies early into a decline – especially when valuations remain rich. It's useful to remember that the 1929 and 1987 crashes started after the S&P 500 was already down about 14% from its highs. So emerging panic is not enough – there has to be some basis to believe that a positive shift in investor attitudes toward risk would be sustainable. Again, falling interest rates, moderate valuations, and very strong market action early into the rebound are useful in separating sustainable advances (even sustainable bear-market rallies) from the fast, furious, prone-to-failure variety. Presently, we don't even see emerging panic. What we do observe, however, is that prices are somewhat oversold on a very short-term basis, so it's reasonable to allow for one of those fast, furious bounces to clear that condition. Not a forecast – particularly because the prevailing Market Climate is unfavorable – but even high-risk markets can produce very strong short-term advances, and investors should not immediately abandon caution when they emerge.” Hussman Weekly Market Comment (link) June 23, 2008 In recent weeks, I’ve expressed very pointed concerns about market risk, emphasizing that the most negative market return/risk profiles we identify are associated with a severely overvalued, overbought, overbullish syndrome of conditions that is then followed by a clear deterioration in market internals (across a broad range of individual stocks, industries, and security types such as low-quality debt). At the same time, it's important to remember that, as in 2000 and 2008, even when we identify market conditions as extremely hostile, short-term action can be something of a coin flip. In some cases, the market can fall to a very oversold short-term low, and then the bottom completely falls out in a vertical decline (as we observed at numerous points during the 2000-2002 and 2007-2009 collapses). In other cases, short-term oversold conditions are “cleared” by what we’ve long called “fast, furious, prone-to-failure” advances. These generally feature lower trading volume than was observed during the preceding decline, with a concentration of buying activity on speculative and heavily-shorted names. That’s essentially how one characterizes a “short-squeeze” – frantic and somewhat price-insensitive efforts to chase a perceived reversal in beaten-down names, coupled with a backing-away of sellers. The result is a nearly vertical but low-volume advance. As I noted last week, “Keep in mind that even terribly hostile market environments do not resolve into uninterrupted declines. Even the 1929 and 1987 crashes began with initial losses of 10-12% that were then punctuated by hard advances that recovered about half of those losses before failing again. The period surrounding the 2000 bubble peak included a series of 10% declines and recoveries. The 2007 top began with a plunge as market internals deteriorated materially (see Market Internals Go Negative) followed by a recovery to a marginal new high in October that failed to restore those internals. One also tends to see increasing day-to-day volatility, and a tendency for large moves to occur in sequence.” My impression is that we are observing a similar dynamic at present. Though we remain open to the potential for market internals to improve convincingly enough to at least defer our immediate concerns about market risk, we should also be mindful of the sequence common to the 1929, 1972, 1987, 2000 and 2007 episodes: 1) an extreme syndrome of overvalued, overbought, overbullish conditions (rich valuations, lopsided bullish sentiment, uncorrected and overextended short-term action); 2) a subtle breakdown in market internals across a broad range of stocks, industries, and security types; 3) an initial “air-pocket” type selloff to an oversold short-term low; 4) a “fast, furious, prone-to-failure” short squeeze to clear the oversold condition; 5) a continued pairing of rich valuations and dispersion in market internals, resulting in a continuation to a crash or a prolonged bear market decline. The panel of charts below shows the Dow Jones Industrial Average in those prior episodes, with the present episode at the lower right. The rounded green arrows identify the bull market peaks in DJIA (or in the 2014 chart, the highest level observed to-date), while the red arrows identify “fast, furious, prone-to-failure” advances that followed the market peak, generally after market internals had already deteriorated. The spikes marked the highest points that the DJIA would see over the remainder of those market cycles, on the way to far deeper bear market lows. The 2000 instance saw an extended period of churning between the January 2000 bull market high in the DJIA and later in the year. The 2000-2002 bear market ultimately asserted itself in earnest once our measures of market internals shifted decidedly negative on September 1, 2000 (see the October 2000 Hussman Investment Research & Insight). In the 2014 chart, the red arrow identifies the rally over the past several sessions. What characterizes the instances below is not simply a decline from a market peak and a subsequent rally, but the sequence from historically extreme overvalued, overbought, overbullish conditions (see Exit Strategy) to a deterioration in market internals, an initial "air pocket" decline, and a subsequent short-squeeze that fails to restore market internals to a favorable condition. Of course, the prior episodes shown below are not themselves indicative of what will occur in the present instance, and current conditions might not be resolved in the same way. Still, investors should interpret recent market strength in its full context: we’ve observed a fast, furious advance to clear an oversold “air-pocket” decline – one that emerged from the pairing of rich valuations with a breakdown in market internals. Having cleared that oversold condition, we remain concerned that the pairing of rich valuations and still-injured market internals may reassert itself.
Given the “all eyes on the Fed” nature of the financial markets here, any predictable component to short-term returns here is likely to be overwhelmed by both random noise and knee-jerk responses to whatever language the Fed chooses in its statement this week. This makes us quite agnostic about near-term market behavior. The next several sessions could contain a significant further short-squeeze or a vertical collapse, and we have very little predictive basis for that distinction. Longer term, we continue to view present market conditions as among the most hostile in history, coupling rich valuations with market internals that remain unfavorable on historically reliable measures. So allow for any sort of action in the near term, but recognize that from a full-cycle perspective, we continue to view a 40-50% market loss as having very reasonable plausibility over the completion of this market cycle. To reiterate what I wrote in June 2008, just before the market collapsed, “Again, falling interest rates, moderate valuations, and very strong market action early into the rebound are useful in separating sustainable advances (even sustainable bear-market rallies) from the fast, furious, prone-to-failure variety.” Those would still be among the primary considerations that would lead us to an optimistic or aggressive market outlook. As always, the strongest market return/risk profiles we identify are associated with a material retreat in valuations coupled with an early improvement in market action. We’ll take our evidence as it arrives. The foregoing comments represent the general investment analysis and economic views of the Advisor, and are provided solely for the purpose of information, instruction and discourse. Please see periodic remarks on the Fund Notes and Commentary page for discussion relating specifically to the Hussman Funds and the investment positions of the Funds. --- The foregoing comments represent the general investment analysis and economic views of the Advisor, and are provided solely for the purpose of information, instruction and discourse. Prospectuses for the Hussman Strategic Growth Fund, the Hussman Strategic Total Return Fund, the Hussman Strategic International Fund, and the Hussman Strategic Dividend Value Fund, as well as Fund reports and other information, are available by clicking "The Funds" menu button from any page of this website. |
|||||||||||||||||||||||||
|
For more information about investing in the Hussman Funds, please call us at
1-800-HUSSMAN (1-800-487-7626) 513-326-3551 outside the United States Site and site contents © copyright Hussman Funds. Brief quotations including attribution and a direct link to this site (www.hussmanfunds.com) are authorized. All other rights reserved and actively enforced. Extensive or unattributed reproduction of text or research findings are violations of copyright law. Site design by 1WebsiteDesigners. |