|
|
||||||
|
|

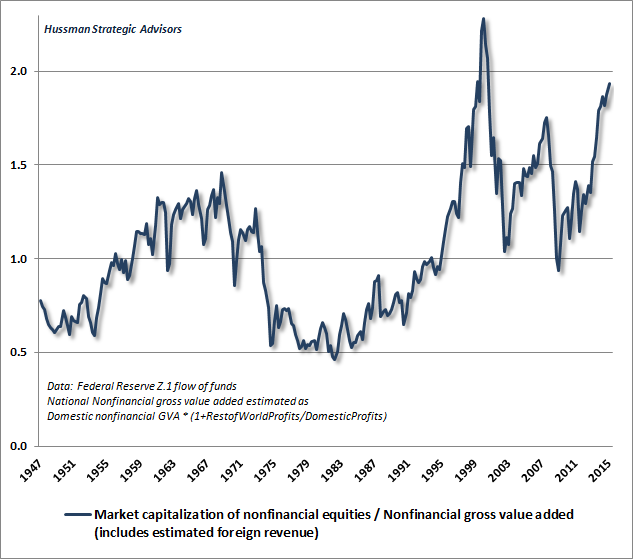
May 25, 2015 Voting Machine, Weighing Machine “Sit down before facts like a child, and be prepared to give up every preconceived notion, follow humbly wherever and to whatever abysses Nature leads, or you shall learn nothing.” Thomas Huxley The greatest miscalculation in my career as an investor has been to underestimate the lengths to which the miscalculation of speculators can extend. I’ve had to correct that error twice, and even if the completion of the market cycle ultimately made the error irrelevant, the challenge was excruciating in the midst of the market cycle, at least until it was fully addressed. The fact is that valuations drive long-term returns, but over shorter horizons, stock prices are the result of whatever investors collectively believe, however reckless or detached from historical evidence those beliefs may be. As long as enough market participants are attached to the idea that risk is their friend (or enemy) regardless of the price, there is no natural limit to how overvalued (or undervalued) stocks can become. There is only one way to address this: measure investor risk preferences directly through observable market internals. Don’t expect an overvalued market to crash until internals deteriorate; don’t embrace an undervalued market too aggressively until internals improve. It’s a lesson that value-investors have learned and re-learned throughout history. Even the legendary value investor Benjamin Graham discovered it, in his case by becoming constructive far too early during the market collapse of the Great Depression. The collective risk preferences of investors rule the short run, but valuations ultimately rule the long run. Graham famously summarized that lesson in one sentence: “In the short run, the market is a voting machine but in the long run, it is a weighing machine.” Investment successes and stumbles largely mirror how closely one's discipline captures that framework. For example, by the mid-1990’s, I had established a reputation not only as a value investor but periodically as a leveraged, raging bull. Unfortunately, my value-conscious bent left me unprepared for the tech bubble, as valuations moved beyond every post-war extreme, and eventually beyond those observed at the 1929 peak. Though value investing had served me well over time, something was missing. As the tech bubble continued, I shifted my thinking. If overvaluation itself was able to bring the market down, then stocks could never become severely overvalued in the first place. From a research standpoint, the right question wasn’t “how much more overvalued can stocks become?” but rather “What distinguishes an overvalued market that continues to advance from an overvalued market that collapses?” The feature that distinguishes an overvalued market that continues higher from one that collapses is the preference of investors toward risk. Across a century of historical evidence, the most reliable observable measure of investor risk preferences proved to be the behavior of market internals based on prices, trading volume, and risk-sensitive securities. Put simply, when investors are risk-seeking, they tend to be risk-seeking in everything, which results in a measurable uniformity of speculation across a wide range of risky assets. The best indication of a shift toward greater risk aversion is a gradual deterioration in the “uniformity” of price action and the appearance of "divergences" across a wide range of individual securities, sectors, and risk-sensitive asset classes. Fortunately, we learned the right lesson, instead of the wrong one that others “learned” during the tech bubble. Too many investors mistakenly “learned” that valuations didn’t matter and that the economy had entered some “new era” where old metrics no longer applied. But recognizing that the uniformity of market internals merely postpones the consequences of extreme overvaluation, I wrote at the March 2000 peak: “The inconvenient fact is that valuation ultimately matters. Trend uniformity helps to postpone that reality, but in the end, there it is... Over time, price/revenue ratios come back into line. Currently, that would require an 83% plunge in tech stocks (recall the 1969-70 tech massacre). The plunge may be muted to about 65% given several years of revenue growth. If you understand values and market history, you know we’re not joking.” As it happened, the S&P 500 lost half of its value, and the Nasdaq 100 Index lost... well, 83%, by the October 2002 market lows. Over the following decade, that distinction between a voting machine and a weighing machine was central to successfully navigating both bubbles and crashes. It allowed us to remain modestly constructive until September 2000 (noting the shift to negative uniformity in October 2000), to move back to a constructive position in early 2003 as a new bull market took hold, and identifying the shift back to hostile market internals in July 2007 as the market was peaking before the global financial crisis. Second lesson, same as the first Following the 2007-2009 market collapse that we correctly anticipated, I insisted in 2009 on stress-testing our methods of estimating market return/risk profiles against Depression-era data. The ensemble methods that emerged from that stress-testing performed better across complete market cycles than anything we had ever tested. The resulting approach included all of those measures of market action, but it also did something very subtle that has made the period since then a terrible experience. In prior market cycles, the emergence of a syndrome of extremely overvalued, overbought, overbullish conditions had reliably overlapped or closely preceded deterioration in market internals. The ensembles picked up that regularity by responding directly to the emergence of those extreme syndromes. In hindsight, the primary effect of quantitative easing in recent years has been to reduce that overlap – extremely overvalued, overbought, overbullish syndromes haven’t been closely followed by a shift toward investor risk aversion, as was true in prior cycles. Even so, when market internals have deteriorated since 2009 (as they did in 2010 and again in 2011), the market has experienced substantial retreats. In mid-2014, we addressed that issue, by completing a series of overlays that we've imposed in order to fully capture the effect of market internals on valuations. Again, simply put, the near-term outcome of speculative, overvalued markets is conditional on investor preferences toward risk-seeking or risk-aversion, and those preferences can be largely inferred from observable market internals and credit spreads. In the long-term, investment outcomes are chiefly defined by valuations, but over the shorter-term, the difference between an overvalued market that becomes more overvalued, and an overvalued market that crashes, has little to do with the level of valuation and everything to do with investor risk preferences (see A Better Lesson than “This Time is Different”). What’s important here is that market internals shifted negative the week ended June 21, 2014 (see Market Internals Suggest a Shift to Risk-Aversion). Our present defensiveness is entirely consistent with the condition of both valuations and market internals here. Indeed, what we observe today is the same combination of extreme overvaluation coupled with unfavorable internals as we observed in 2000 and 2007. Recall, however, that both periods involved somewhat extended top formations with increasing internal divergences, so while conditions could devolve into a collapse fairly quickly, we can't rely on that as an immediate outcome. An improvement in market internals would lessen our concerns about vertical market losses, but would not make current valuation extremes any less hostile to long-term returns. There’s no question that I’ve earned criticism for that inadvertent need to re-impose something that was already captured by our pre-2009 methods. But only a fool criticizes another for their errors and stops with that. A wiser person insists on learning the right lesson from those errors. Be careful to learn the right lesson: valuations drive long-term returns, but shorter-term outcomes are driven by investor risk preferences, which can be inferred from market internals, credit spreads, and other risk-sensitive measures. The wrong lesson is that valuations are irrelevant. The wrong lesson is that historically reliable valuation metrics no longer apply. The wrong lesson is that equity valuations are tightly related to the level of Treasury yields. The wrong lesson is that Fed easing prevents market losses. The following charts are presented here, in one place, to help investors to resist learning the wrong lessons. As the scientist Thomas Huxley wrote more than a century ago, “Sit down before facts like a child, and be prepared to give up every preconceived notion, follow humbly wherever and to whatever abysses Nature leads, or you shall learn nothing.” One of the best single measures of prospective 10-year S&P 500 total returns is the ratio of nonfinancial market capitalization to nonfinancial gross value added (essentially corporate revenues without double-counting), including estimated global revenues. See The New Era is an Old Story for details. The chart below updates this measure as of last week’s close (the variant including financials is even more extreme).
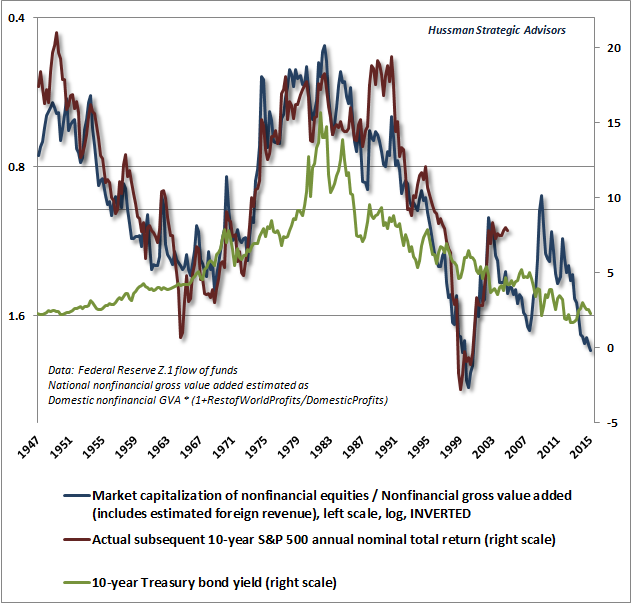
The following chart shows current valuations on an inverted log scale, along with the actual subsequent nominal annual total return of the S&P 500 over the following decade. The correlation is 92%. The 10-year Treasury yield is also presented in green, to disabuse the notion that either equity valuations or actual realized equity returns are tightly determined by the level of interest rates. Put simply, depressed valuations are associated with strong subsequent long-term equity returns; elevated valuations are associated with poor subsequent long-term equity returns. Interest rates are useful for comparative purposes, but don’t imagine that low interest rates can be associated with both elevated equity valuations and satisfactory long-term equity returns. At present, we estimate prospective 10-year nominal total returns for the S&P 500 to be about zero, based on the most historically reliable valuation measures we identify.
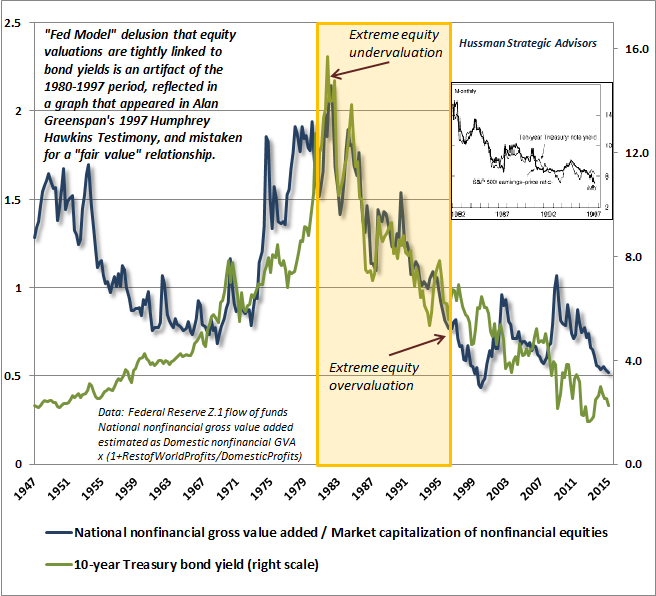
So why does Wall Street keep saying that stocks are “fairly valued relative to bonds”? Why does Janet Yellen say “equity market valuations at this point generally are quite high. Now, they’re not so high when you compare the returns on equities to the returns on safe assets like bonds”? The answer is that they’ve bought into the so-called “Fed Model” – which assumes that there is some one-to-one relationship between bond yields and prospective equity returns. The inconvenient fact is that bond yields explain only a fraction (less than 20%) of the variance in equity valuations and actual subsequent 10-year market returns. I've re-scaled the above chart in a very particular way below. The central thing to notice is the period from 1980 to 1997. This is the period that the “Fed Model” is based on. During that period, bond yields declined as a result of disinflation, while stock valuations moved from historic undervaluation to historic overvaluation. Yet the Fed Model incorrectly views this as if it reflects a “fair value” relationship between stock valuations and bond yields. The model is an artifact that results from the failure to examine data outside of this one narrow period.
Unfortunately, the Federal Reserve has now created the third financial bubble in 15 years. Focusing on two variables – inflation and unemployment – the Fed has missed the most important consideration: the risk to financial stability. It is the same mistake the Fed made during the housing bubble. This mistake will ultimately end just as tragically. The only question is how much worse the Fed makes the situation in the interim. If investors develop a fresh preference for risk-seeking (which we can never rule out), we would observe that shift through the behavior of market internals, and we would expect to dial back our concerns about immediate market risk (though we would encourage a material safety net in any event). Even if that occurs, don’t think for a second that the eventual outcome for the financial markets or the economy would ultimately be better for it. For now, our concerns remain extremely high due to the combination of obscene valuations and unfavorable market internals. While we continue to monitor the evidence for any shift, it’s important not to assume that Fed easing (or a delay of Fed rate hikes) would necessarily provoke a favorable shift in market internals, or would necessarily produce a shift back to risk-seeking. Investor risk preferences are not necessarily responsive to Federal Reserve actions, as much as speculators might wish that to be so. Examine the worst market collapses in history, and you’ll often find the Federal Reserve easing the whole time. Don't fight the Fed, indeed.
Whether or not the Fed or some other central bank will start, continue, or stop doing X – whatever "X" might be - these are all secondary questions. The central question, and the only one we must be attentive to, is whether the risk preferences of investors have shifted. The primary way to measure that response is through the uniformity or divergence of market internals. At present, market internals have already deteriorated, so we are sensitive not only to the likelihood of dismal long-term returns, but also the risk of vertical market losses in the intermediate term. In the event that market internals improve, we expect that the prospect for long-term market returns will remain dismal from current valuations, but the shorter-term risks may be deferred. We’ll take our evidence as it emerges. The foregoing comments represent the general investment analysis and economic views of the Advisor, and are provided solely for the purpose of information, instruction and discourse. Please see periodic remarks on the Fund Notes and Commentary page for discussion relating specifically to the Hussman Funds and the investment positions of the Funds. --- The foregoing comments represent the general investment analysis and economic views of the Advisor, and are provided solely for the purpose of information, instruction and discourse. Prospectuses for the Hussman Strategic Growth Fund, the Hussman Strategic Total Return Fund, the Hussman Strategic International Fund, and the Hussman Strategic Dividend Value Fund, as well as Fund reports and other information, are available by clicking "The Funds" menu button from any page of this website. |
|||||||||||||||||||||||||
|
For more information about investing in the Hussman Funds, please call us at
1-800-HUSSMAN (1-800-487-7626) 513-326-3551 outside the United States Site and site contents © copyright Hussman Funds. Brief quotations including attribution and a direct link to this site (www.hussmanfunds.com) are authorized. All other rights reserved and actively enforced. Extensive or unattributed reproduction of text or research findings are violations of copyright law. Site design by 1WebsiteDesigners. |