|
|
||||||
|
|

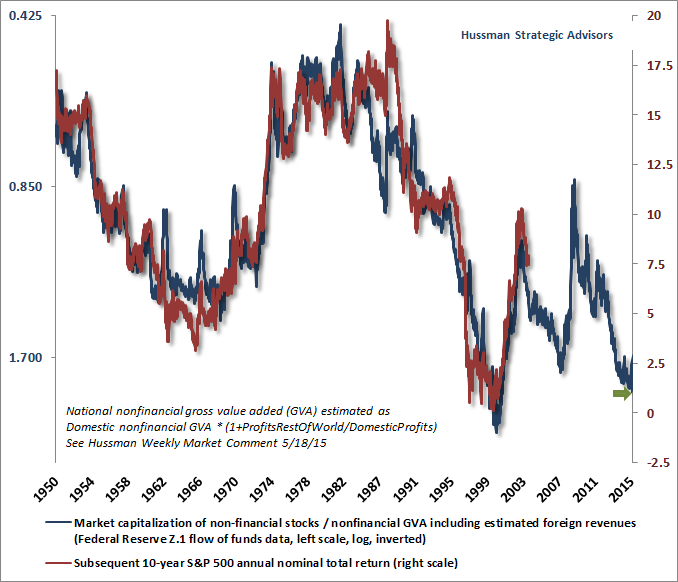
October 19, 2015 The Hinge One of the central themes I’ve emphasized over the past year is the critical importance of using market internals as a gauge of investor risk-seeking and risk-aversion. Over the long-term, investment returns are driven by valuations – particularly on a 10-12 year horizon. Over shorter horizons, and more limited portions of the market cycle, the primary driver of investment returns is the preference of investors to seek or avoid risk. Risk-seeking and risk-aversion, as evidenced by the uniformity of market internals across a broad range of individual stocks, industries, sectors and security types – including debt securities of varying creditworthiness – is the hinge that determines whether overvaluation is likely to be met with further market gains or with market collapse; whether an apparent uptrend in the major indices is likely to persist or unravel; and whether easing by the Federal Reserve is likely to support further speculation or simply accompany a plunging equity market. For extensive discussions and historical data on this theme, see A Most Important Distinction, The Line Between Rational Speculation and Market Collapse, A Better Lesson Than “This Time Is Different”, Valuation and Speculation: The Iron Laws, and When An Easy Fed Doesn’t Help Stocks. I’ve often noted that it’s not unusual for the market to follow the initial break from a market peak with a rally back to prior support. Following the air-pocket last summer, the S&P 500 has now rebounded toward its 200-day moving average, and is about 5% from its highest extreme in history. This begs the question of whether market internals have recovered as well. The answer, for now at least, is emphatically no. Indeed, only 37% of individual stocks are above their own respective 200-day moving averages, while credit spreads remain stubbornly wide. It’s also important to consider the current position of the market from a longer-term perspective. On valuation measures that we find most strongly correlated with actual subsequent market returns, current valuations now exceed every extreme in history except for the period from July 1999 to December 2000. Indeed, the more historically reliable the measure (see the mean-inversion commentary above for a relative ranking), the closer current valuations are to the 2000 extreme. On a 12-year horizon, we presently estimate average annual nominal total returns for the S&P 500 averaging just 1% annually, with negative expected returns on horizons of 10-years and less. The chart below shows the ratio of nonfinancial market capitalization to corporate gross value added on an inverted log scale (blue line, left scale), compared with actual subsequent 12-year nominal S&P 500 annual total returns (red line, right scale).
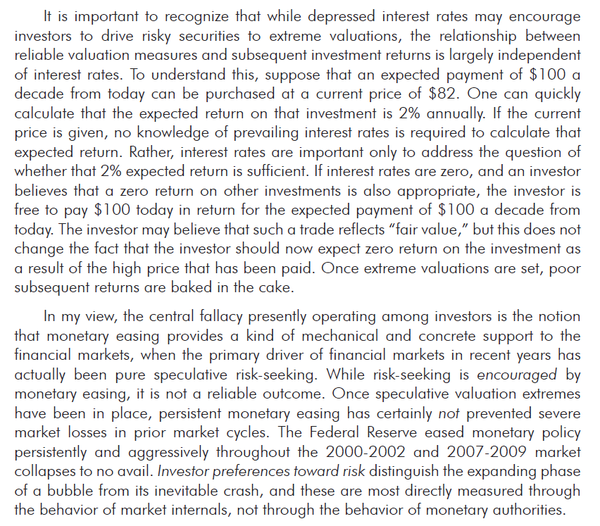
Investors are free to take their chances if they believe the 93% correlation between valuations and subsequent market returns is merely random or spurious. Those hoping for actual 12-year returns to significantly overshoot roughly 1% annually are actually relying on a future valuation bubble. As I noted a few weeks ago, “While valuations and actual subsequent market returns are extremely well-correlated over time, we should still expect the largest ‘errors’ in the chart to be associated with points where valuations were furthest away from their historical norms at the end of a given 12-year horizon. In particular, we would expect actual market returns to have overshot the expected return in 1986-1988 (corresponding to the 1998-2000 bubble peak, 12 years later). That’s exactly what we see, and exactly why we see it.” For a more extensive historical review of reliable valuation measures and their implications for long-term returns, see All Their Eggs In Janet’s Basket, Ockham’s Razor and The Market Cycle, Why Stocks Are Not Cheap Relative To Bonds, and Valuations Do Not Only Mean-Revert, They Mean-Invert. We continue to observe a widespread misconception about how interest rates relate to valuations. I would reprint the following segment from our 2015 Annual Report every week if I thought it would help. As things stand, investors seem bent on living through a long period of predictably weak market returns over the coming 10-12 years (from current market levels), while subjecting themselves to severe interim drawdowns as they did in the decade that followed the 2000 valuation extreme, all in the belief that low interest rates somehow raise the prospective return of an obscenely overvalued market.
The second paragraph above is also worth emphasizing. It’s not Fed easing itself that supports the market. What matters is the risk-seeking behavior of investors. Fed easing can contribute to that, but the two do not overlap nearly as well as investors seem to believe. The Fed eased repeatedly during the 1981-82 bear market, the 2000-2002 plunge, and the 2007-2009 collapse. Fed easing simply does not provide reliable support for the market once investors become risk-averse, because in that environment, low-interest but safe liquidity is a desirable asset rather than an inferior one. With broad market internals clearly deteriorating while capitalization-weighted indices continue to churn in a broad top formation, the largest short-term challenge is that broadly diversified portfolios that are not capitalization-weighted have tended to materially lag the S&P 500 over the past year; particularly those that lean toward more value-conscious selection approaches. That dispersion between the broad market and the cap-weighted indices is the main reason that hedged-equity strategies have had difficulty gaining much traction. From a historical perspective, the deterioration of market internals is a clear red-flag for cap-weighted indices. Conversely, we would only expect sustained strength on the cap-weighted front if market internals also strengthen broadly. In either event, I expect that the performance gap between the average stock and the capitalization-weighted market will tend to narrow or reverse as the market cycle progresses. The Hinge Is the weak behavior of market internals a meaningful factor for the S&P 500 here? Let’s consider several market conditions from a historical perspective. Since 1972, the S&P 500 has been above its 200-day moving average about 71% of the time. During those periods, the annualized total return of the S&P 500 has averaged 12.1%, producing a 34-fold cumulative gain, and a maximum interim loss of -26% when restricting to this condition. In contrast, the S&P 500 has been below its 200-day moving average about 29% of the time. During those periods, the annualized total return of the S&P 500 has averaged 5.7%, producing a 2-fold cumulative gain, but a maximum interim loss of -53% restricted to this condition. Since that average return is somewhat above the average Treasury bill yield during corresponding periods, it turns out that a switching strategy based on the 200-day average would have somewhat underperformed a passive buy-and-hold approach, though with smaller interim losses. Now let’s partition those periods further. In about 7% of history since 1972, the S&P 500 has been above its 200-day average but with fewer than 50% of individual stocks above their own 200-day averages. During those periods, the S&P 500 has actually experienced a modest cumulative loss, with a maximum interim loss of -26%. In contrast, in periods where both the S&P 500 and more than 50% of individual stocks have been above their 200-day moving averages, the S&P 500 has enjoyed a 36-fold cumulative gain, a 13.9% annualized total return, and a maximum interim loss under those conditions of just -20%. In about 5% of historical periods, the S&P 500 has been below its 200-day average, but more than 50% of stocks have been above their 200-day averages. In that subset of periods, the market has experienced a cumulative -24% loss, and a maximum interim loss of -37%. Interestingly, the majority of these periods were ones where our broader measures of market internals were negative as well. This underscores an important point: when investors are risk-seeking, they tend to be indiscriminate about it – dispersion tends to be unhealthy. Here’s where things get interesting. What happens when you’ve got uniformity, but both the S&P 500 and the majority of individual stocks are falling rather than rising? In 24% of historical periods, the S&P 500 has been below its 200-day average and more than 50% of individual stocks have also been below their respective 200-day moving averages. One might expect this to be the worst of all conditions, but total returns actually average about 9.7% annualized, producing a more than 2-fold gain under that condition. However, that gain comes at a huge maximum interim loss of -50%. So the overall outcome is actually an average return, but with a great deal of risk. Things get even more interesting when we take a closer look at these periods. What’s really going on in this “negative, negative” set of conditions that the entire overall return is captured by just half of the instances – and this subset can be identified based on observable market conditions. Specifically, about 12% of market history reflects conditions where both the S&P 500 and more than 50% of individual stocks were falling, but where broader measures of market internals (including credit spreads and other factors) were already showing positive divergences. That subset of instances captures a nearly 3-fold gain, with a -15% maximum drawdown. Using the language I often use to describe various market climates, these periods reflected oversold lows that were coupled with early improvement in market internals. Positive divergence among broad market internals is the essential feature that lowers the risk of trying to catch what would otherwise be a falling knife. The remaining 12% of periods in that “negative, negative” situation produce a modest cumulative loss, but include a -49% maximum interim loss. In those periods, the issue is not that the market never advanced; in order to generate only a slight negative return despite a -49% interim loss, it’s clear that the market had to gain significantly at various points. The real issue is that in the absence of positive divergences across broader market action, gains from attempting to buy into a plunging market were just as likely as losses, and those potential losses were severe, so the average return/risk profile was quite poor. Simply put, market internals – as broadly defined as possible – comprise the most reliable measure of investor risk-seeking or risk-aversion, and act as a hinge that determines whether other market conditions are likely to have a positive or unfavorable impact on market returns. That hinge determines which way the market is likely to swing in response to valuations, Fed action, moving average crossings, investor sentiment, and a host of other widely followed considerations. While this bubble - too - will likely collapse, bullish opportunities will be plentiful soon enough I’ve regularly detailed the challenges that followed my 2009 insistence on stress-testing our methods against Depression-era data, and how we ultimately addressed them in mid-2014. Since then, the only thing this market cycle has under its belt is a year-long, range-bound top formation where the average stock has deteriorated more rapidly than the cap-weighted indices. Until we get a larger portion of a market cycle behind us, it may help both the patience and confidence of some investors to again underscore the esssential lesson of that transition. Skim over the next two paragraphs if that review isn't necessary. In prior market cycles across history, the emergence of an extreme overvalued, overbought, overbullish syndrome of conditions generally either accompanied or shortly preceded a breakdown in market internals, reflecting a shift toward risk-aversion among investors. Steep air-pockets, panics and crashes typically followed. The advancing portion of the current market cycle was legitimately different from other market cycles across history in one respect: in the presence of aggressive and intentional efforts by the Federal Reserve to promote yield-seeking speculation, investors – who were already inclined to seek risk – continued to seek risk well after those overvalued, overbought, overbullish syndromes emerged. One had to wait until market internals explicitly deteriorated in order to take a strongly negative outlook on stocks. In the face of obscene valuations, overbought conditions, and overbullish sentiment, one could certainly be neutral at times, but the advancing half-cycle since 2009 clarified a critical distinction – and a hard-won distinction at that. This distinction was not obvious in historical data, because of the strong overlap in prior market cycles between the emergence of overvalued, overbought, overbullish conditions and the shift toward risk-aversion among investors. The essential lesson is this: before taking a hard-negative market outlook, a shift toward risk-aversion among investors should be inferred directly from the behavior of market internals, rather than anticipating it on the basis of overextended market conditions. The best approach is to prioritize the uniformity or divergence of market internals over-and-above those broader measures of overextended market action. Last year, we imposed that requirement on our methods of classifying market return/risk profiles. Despite the fact that I’ve advocated a constructive or aggressive market outlook following every bear market decline in the past three decades (including late-2008 after the market plunged by over 40%), I understand the “permabear” label. My insistence on stress-testing our methods against Depression-era data in 2009 truncated that late-2008 constructive shift, missed the initial rebound as we struggled with that “two data sets” problem, kept us defensive too long, and threw a wrench into what was by then a rather outstanding reputation (which I have every expectation of restoring over the completion of this cycle, thanks very much). Though valuations remain wickedly elevated at present, as a practical matter, investors should expect us to have a substantially bullish disposition over complete market cycles – particularly given the adaptations that we introduced in mid-2014. Across history, our present methods would have encouraged a constructive or aggressive investment stance in about 60% of market conditions over time, with an outlook as defensive as we have today only about 8-9% of the time. It’s fine for investors wait for evidence of that bullish disposition – possibly to their surprise at the point we advocate an unhedged or leveraged stance, most likely on the same event that has encouraged that shift in other market cycles: a significant retreat in valuations coupled with an early improvement in market internals. Those who have followed my work over time should expect that already, because they know I advocated a constructive or aggressive (even leveraged) outlook after other bear markets. They know the narrative of how and why we ran into difficulty after my 2009 stress-testing decision, and what we’ve done to address it. I expect market conditions to support a constructive or aggressive market outlook – at least as often as not – as the current cycle completes and future cycles progress. Those who have followed my work over time also know that I’ve struggled greatly with the three bubbles since the late-1990’s, particularly with the most recent one. Remember that in both previous instances, our value-conscious, historically-informed discipline came out quite nicely over the complete market cycle, and the reason is simple: bubbles inevitably collapse. The tight link between valuations and subsequent long-term market returns is illustrated in the chart at the beginning of this weekly comment. Investors should brace for an unrewarding 10-12 year trip to nowhere for the S&P 500, but with lots of excitement – probably with two deep cyclical bear market plunges and enthusiastic bull market advances along the way. Even if valuations remain rich in comparison with historical norms for some time, I expect that shifts in the condition of market internals will help to distinguish constructive opportunities from probable risks. Rather than ignoring clear evidence of obscene valuations and weak market internals today, my advice would be to heed the evidence now, and ignore me in the future if I don't shift to a constructive outlook when valuations and broad market internals improve. I doubt that situation will arise, but if it does, I think it's difficult to go far afield by sticking with the discipline implied by the Iron Laws: be aggressive when valuations and market action are jointly favorable; be measured when valuations are favorable but market action is not; avoid being more defensive than neutral if the market is overvalued but market internals remain favorable; and run for the hills like a bunny when an extended period of overvalued, overbought, overbullish conditions is followed by a breakdown in market internals. If you’re not running like a bunny here, at least make sure that the equity position you hold is a position you would not abandon if the S&P 500 was to drop in half - I certainly would not rule out that outcome. The latest QE bubble has not only been reckless, it has been senselessly encouraged by blithe central bankers who seem concerned about neither speculative risks, capital misallocation, nor the fact that their policy tools have no meaningful historical correlation with their primary policy targets. The Fed might as well be using a Ouija board as a policy tool. While Ben Bernanke’s new book, The Courage to [Violate the Federal Reserve] Act reflects the self-important delusion that Fed action ended the global financial crisis, the fact is that Fed-induced yield-seeking speculation had a much greater role in causing the crisis than any other factor, by feeding demand for mortgage securities – regardless of the creditworthiness of the borrowers – and fueling a housing bubble. As the bubble collapsed, banks and other financial institutions plunged toward insolvency, as losses on mortgage-backed securities dragged the assets on their balance sheets toward - or below - the value of the liabilities they owed to depositors and bondholders. The crisis effectively ended with the stroke of the pen by the Financial Accounting Standards Board. That happened on March 16, 2009, when the FASB announced its intention to abandon mark-to-market rules, in response to Congressional pressure by the House Committee on Financial Services on March 12, 2009. The final vote was on April 2, 2009. Read those links, and the reality of what happened will become clear. The decision gave banks and other financial institutions “significant judgment” in the values that they assigned to assets, rather than booking them at market value. With that discretion, financial institutions could use cash-flow models (“mark-to-model”) to instantly transform previously insolvent balance sheets to solvent ones. They immediately did just that, and in hindsight, regulators went along with it. Fed-induced yield-seeking has certainly had the effect of amplifying the speculative preferences of investors when they are already inclined to seek risk (though Fed action has little impact when investors are risk averse, as we saw during the collapse of the two bubbles that preceded this one). The ability to infer investor risk-preferences from market internals is the most useful way to distinguish speculative bubbles – even yield-seeking ones – from the inevitable collapses that follow. I’m convinced we have the right tools to do so here, and to do a far more adept job of navigating future (or continued) bubbles, should that occur. Presently, market internals remain hostile. Along with price-volume behavior and other factors, we're seeing indications that the knee-jerk rebound from the market’s lows several weeks ago is becoming exhausted. My views here are essentially the same as they were in late-2007 after the market rebounded following its initial break: “Stocks aren't overbought here, but overbought conditions in unfavorable Market Climates tend to be rare. The steepest bear market losses tend to follow immediately on the heels of such overbought conditions. As I've noted before, the only times I ever have a clear short-term expectation about market direction is either when the market is overbought in a negative Market Climate, or oversold in a favorable Market Climate.” I view the market as vulnerable here given the combination of obscene valuations and unfavorable market internals. We can’t rule out a further advance, or even a firming of currently poor market internals. But based on the evidence here and now, the market entered a particularly extreme subset of negative return/risk profiles last week, which we’ve only observed in about 2% of historical periods. I won’t pound the table over it – it’s enough to say that the current profile is quite negative. On the subject of what would move us to a less defensive outlook (or even constructive with a safety-net), an improvement in market internals really would be the central requirement. An improvement in market internals following a material retreat in valuations would encourage a much more constructive or even aggressively bullish shift. It’s sufficient to respond as market conditions change. At present, we advocate a strongly defensive outlook. The foregoing comments represent the general investment analysis and economic views of the Advisor, and are provided solely for the purpose of information, instruction and discourse. Please see periodic remarks on the Fund Notes and Commentary page for discussion relating specifically to the Hussman Funds and the investment positions of the Funds. --- The foregoing comments represent the general investment analysis and economic views of the Advisor, and are provided solely for the purpose of information, instruction and discourse. Prospectuses for the Hussman Strategic Growth Fund, the Hussman Strategic Total Return Fund, the Hussman Strategic International Fund, and the Hussman Strategic Dividend Value Fund, as well as Fund reports and other information, are available by clicking "The Funds" menu button from any page of this website. |
|||||||||||||||||||||||||
|
For more information about investing in the Hussman Funds, please call us at
1-800-HUSSMAN (1-800-487-7626) 513-326-3551 outside the United States Site and site contents © copyright Hussman Funds. Brief quotations including attribution and a direct link to this site (www.hussmanfunds.com) are authorized. All other rights reserved and actively enforced. Extensive or unattributed reproduction of text or research findings are violations of copyright law. Site design by 1WebsiteDesigners. |