|
|
||||||
|
|

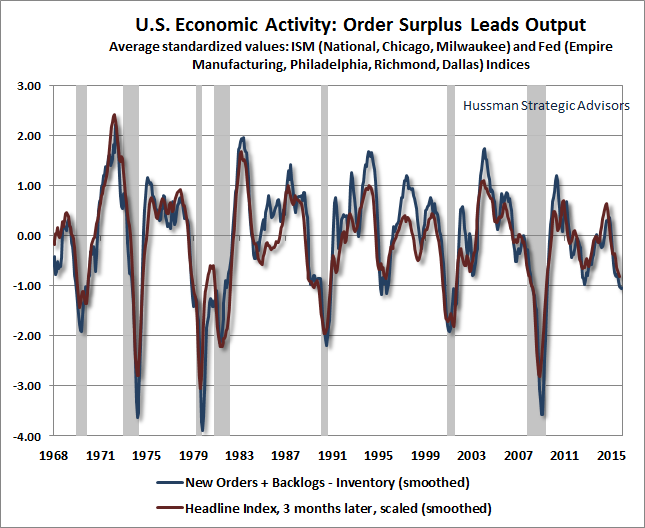
November 23, 2015 Dispersion Dynamics Two types of dispersion are increasingly apparent in market dynamics here. The first type of dispersion is between leading measures of economic activity and lagging ones. The second is dispersion in market internals, particularly observable in a continued narrowing of leadership to a handful of “winner-take-all” stocks, while broader measures of market action across individual stocks, industries, sectors, and credit spreads show persistent divergence that suggests increasing risk-aversion among investors. As I’ve frequently noted, if one examines the correlation profiles of various economic indicators with subsequent economic activity, there is a clear sequence. The earliest indications of an oncoming economic shift are observable in the financial markets, particularly in changes in the uniformity or divergence of broad market internals, and widening or narrowing of credit spreads between debt securities of varying creditworthiness. The next indication comes from measures of what I’ve called “order surplus”: new orders, plus backlogs, minus inventories. When orders and backlogs are falling while inventories are rising, a slowdown in production typically follows. If an economic downturn is broad, “coincident” measures of supply and demand, such as industrial production and real retail sales, then slow at about the same time. Real income slows shortly thereafter. The last to move are employment indicators — starting with initial claims for unemployment, next payroll job growth, and finally, the duration of unemployment. What we observe at present is something of a race. The most lagging and backward-looking measures of the economy continue to show the most strength; precisely because they indicate what is in the past rather than what is in the future. Unemployment duration continues to fall, payroll growth has enjoyed a recent upward surprise, and initial claims for unemployment — though flattening out — remain near multi-year lows. Largely on the basis of improvements on the employment front, the Fed is quite eager to move away from zero interest rate policy by hiking the Federal funds rate in December (by paying banks a fraction of a percent more on idle excess reserves) — a move that is now broadly anticipated on Wall Street. Meanwhile, the most leading and forward looking measures of the economy continue to deteriorate. The race, in this context, is whether the economic weakness that’s already evident in the leading measures actually becomes reflected in the employment numbers soon enough to derail a rate hike. The chart below updates our measure of “order surplus” based on standardized values of regional Fed and purchasing managers surveys. My impression is that this chart presents a good representation of the actual state of the economy here — deteriorating enough to create a clear risk of recession, but not profoundly enough to establish a confident expectation of recession.
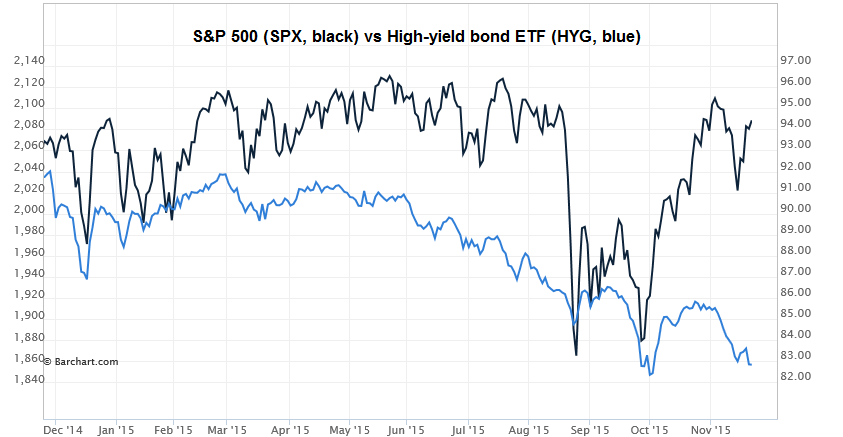
It’s tempting to make predictions about whether incoming economic data will weaken enough to derail a December rate hike, or whether lagging employment figures will remain strong enough to encourage “liftoff” by the Fed. But from an investment standpoint, the actions of the Fed, either way, are not nearly as important to monitor as the behavior of market internals. The impact of Fed actions is strongly dependent on the prevailing condition of market internals (see When An Easy Fed Doesn’t Help Stocks, and When it Does). If we observe improvement in broad internals and credit spreads, it will suggest a shift back toward risk-seeking by investors, and virtually whatever the Fed does will be favorable for stocks. If internals remain unfavorable, virtually anything the Fed does will be unfavorable as well. Historically, the worst market outcomes have unfolded when the Fed has eased in an overvalued market where internals have become unfavorable (suggesting growing risk-aversion among investors). Investors should remember that the Fed cut rates in late-2007 and early-2001, just as deep market collapses were beginning, and additional persistent and aggressive Fed easing did nothing to prevent stocks from collapsing for nearly two years both instances. A Fed easing in an overvalued market with poor internals is almost always a response to weakening economic fundamentals. Fed easing emphatically does not support stocks in that kind of risk-averse environment because risk-free liquidity is viewed as a desirable asset rather than an inferior one. The upshot is that unless market internals improve, a decision by the Fed not to hike interest rates would likely be a very negative signal for investors. Even from an economic standpoint, there’s little evidence in the historical record that activist Fed policy has a significant or reliable impact on subsequent economic activity. Economic downturns tend to be mean-reverting and self-correcting, so a large economic shortfall tends to be followed by subsequent economic strength. There's clear economic evidence that fiscal policies targeting productive investment can be quite effective (particularly investment tax credits, accelerated depreciation, and certain infrastructure expenditures), but even without those initiatives, we observe substantial mean-reversion in output. On the inflation front, the level of inflation remains positively correlated with previous levels of inflation for about 6 years (with zero correlation after about 9 years), but changes in inflation are negatively correlated with the preceding level of inflation right off the bat, meaning that very high inflation tends to be followed by falling inflation, and very low inflation tends to be followed by rising inflation. Systematic monetary policy approaches such as the Taylor Rule suggest linking monetary policy targets to observable variables, such as output shortfalls and the prevailing rate of inflation. These have historically described Fed policy fairly well, with notable exceptions in recent years. As Stanford economist John Taylor observed last week, Janet Yellen’s objection to calls for more systematic Fed policy “ignores the harm that came from deviating from rules-based policy in the period leading up to the crisis.” Since Fed policy changes have historically tracked observable economic variables in a fairly systematic way, it’s difficult to disentangle whether subsequent changes in output and inflation were actually supported by Fed policy or whether they would have naturally occurred anyway. We're inclined to give that systematic component of policy the benefit of the doubt. Still, we do know that activist deviations from systematic monetary policy have no relationship with later economic activity. For example, the difference between the actual Fed Funds rate and the rate prescribed by the Taylor rule has zero correlation with subsequent economic growth. Moreover, Fed activism has been the central cause of financial distortions, yield-seeking speculation, and subsequent collapses that have devastated the U.S. economy in recent cycles. If there was evidence in the historical data to suggest that a rate hike would materially weaken the economy, we would argue against a rate hike, because the economy is weakening already. Even so, whatever “policy error” the Fed might make here utterly pales in comparison with what has already become the most spectacular episode of monetary policy error we will likely see in our lifetimes. The primary impact of extraordinary monetary policy in recent cycles has been to provoke a series of speculative bubbles and collapses. We are now observing the third speculative financial bubble since 2000. At best, Fed actions will modestly affect the timing of the inevitable fallout. In recent years, Federal Reserve policy has been little but an engine of yield-seeking speculation, hypervaluation, expansion of low-grade debt, and global malinvestment of exactly the sort that produced the worst financial crisis since the Great Depression. If the Fed is to do anything, we strongly believe that the Fed should immediately stop reinvesting the proceeds of maturing assets on its balance sheet, as the Fed could run off about $1.4 trillion without placing any upward pressure at all on interest rates. Absent any reduction in the size of the Fed’s balance sheet (which would lower the ratio of the monetary base to nominal GDP), the only way to raise interest rates here is by literally paying banks on their idle excess reserves. The only impact from that operation will be to draw a significant amount of zero-interest currency out of circulation and into the banking system, thus creating an even larger pile of idle bank reserves. Weak market internals persist The second type of dispersion we observe here is in market internals. Credit spreads remain in an uptrend, suggesting increasing concerns among investors about the potential for credit defaults among highly leveraged borrowers. The chart below shows the S&P 500 (black) compared with the persistent weakness of low-grade bonds, as tracked by the high-yield exchange-traded fund (HYG).
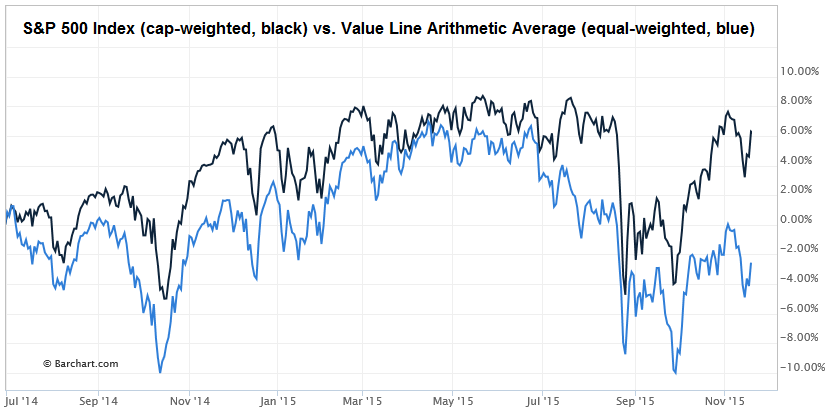
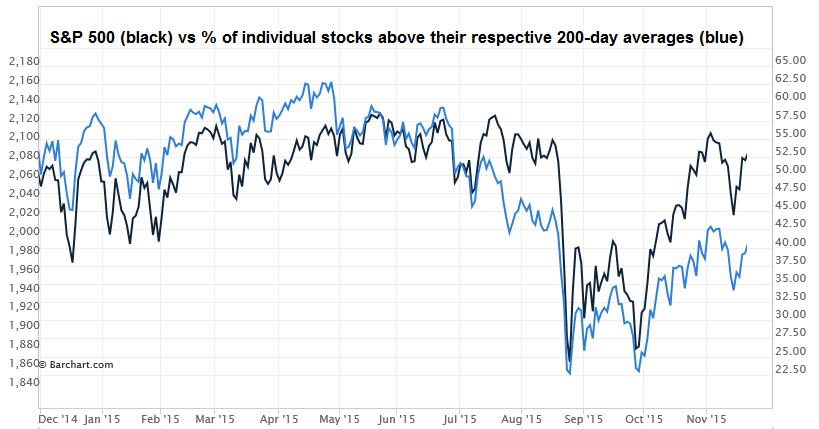
Even with the capitalization-weighted S&P 500 just short of its record May high, only about 40% of individual stocks remain among their respective 200-day moving averages. Even for the S&P 500 itself, the entire year-to-date gain in the index has been driven by a handful of companies that enjoy “winner-take-all” network effects. These stocks still benefit from the same sort of can’t lose mentality that we observed during the top-formations of previous speculative bubbles — for example, the ‘onics and ‘tronics stocks of the late-60’s Go-Go market, the Nifty Fifty of the 1973 peak, the dot-com stars and later the Four Horsemen of the tech bubble, and the financials that came to dominate market capitalization during the housing bubble. The chart below shows the relative performance of the capitalization-weighted S&P 500 Index (black) and the Value Line Index (blue), an equal-weighted arithmetic index of 1700 of the best-known companies in the stock market. The performance gap between these two indices since mid-2014 has been about 9%, which is the primary reason that many hedged-equity strategies have had difficulty during this period. If one is long a diversified portfolio of stocks and hedged using capitalization-weighted indices such as the S&P 500, one of the only ways for a hedged strategy to gain traction lately has been to over-weight the most speculative stocks in the market, even beyond their lopsided weights in the S&P 500 itself. There’s some rationale for hedged strategies to hold something greater than a zero position in these stocks, if only to lower their “tracking risk” versus the cap-weighted indices. But whether one is hedged or not, we view the strategy of overweighting the most speculative stocks to be a sure path to short-term acclaim and longer-term loss. That’s a lesson that should have been learned from other bubbles.
Historically, this sort of internal divergence, emerging after an extended period of extreme overvalued, overbought, overbullish conditions, has been a precursor to severe market weakness. If market internals improve, this divergence will narrow, and there will be a reduced need to hedge as aggressively against probable market losses in the first place. In either case, we view the situation as transitory. One observes a similar picture examining the S&P 500 Index (black) versus the percentage of stocks above their respective 200-day moving averages (blue). The average stock has been much less resilient in recent months than the capitalization-weighted indices, primarily because a handful of extraordinarily large “winner take all” stocks have been responsible for the lion’s share of the market gain.
The foregoing comments represent the general investment analysis and economic views of the Advisor, and are provided solely for the purpose of information, instruction and discourse. Please see periodic remarks on the Fund Notes and Commentary page for discussion relating specifically to the Hussman Funds and the investment positions of the Funds. --- The foregoing comments represent the general investment analysis and economic views of the Advisor, and are provided solely for the purpose of information, instruction and discourse. Prospectuses for the Hussman Strategic Growth Fund, the Hussman Strategic Total Return Fund, the Hussman Strategic International Fund, and the Hussman Strategic Dividend Value Fund, as well as Fund reports and other information, are available by clicking "The Funds" menu button from any page of this website. |
|||||||||||||||||||||||||
|
For more information about investing in the Hussman Funds, please call us at
1-800-HUSSMAN (1-800-487-7626) 513-326-3551 outside the United States Site and site contents © copyright Hussman Funds. Brief quotations including attribution and a direct link to this site (www.hussmanfunds.com) are authorized. All other rights reserved and actively enforced. Extensive or unattributed reproduction of text or research findings are violations of copyright law. Site design by 1WebsiteDesigners. |