|
|
||||||
|
|

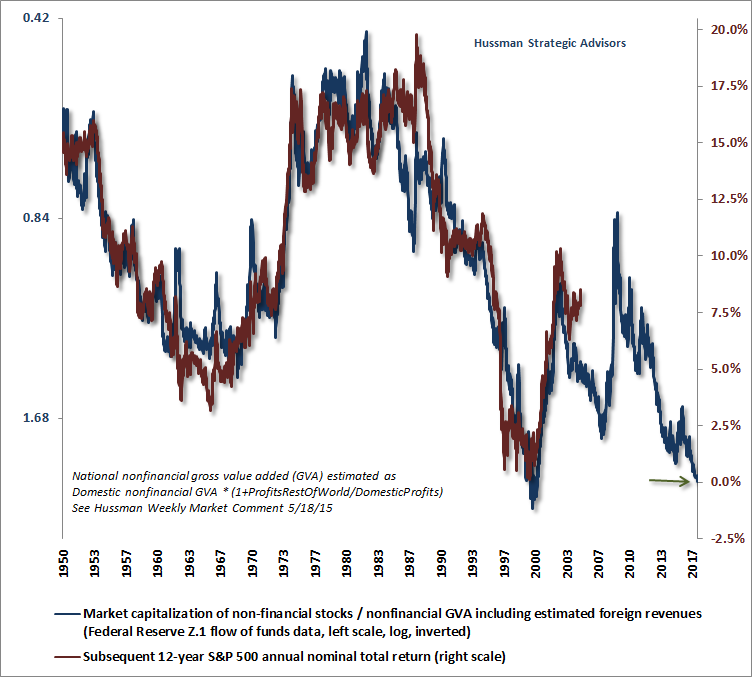
September 18, 2017 Eyes Wide Shut At the October 2002 market low, the S&P 500 stood -49.2% below its March 2000 peak (-48.0% including dividend income), with the Nasdaq 100 having lost more than -82.8% from its high, on the basis of both price and total return. The loss wiped out the entire total return of the S&P 500, in excess of Treasury bills, all the way back to May 1996. The bull market that followed would bring the S&P 500 to a fresh high by October 2007. Unfortunately, in the face of historically extreme valuations, that victory also proved temporary, and the S&P 500 collapsed by -56.8% (-55.2% including dividends) by March 2009, with the Nasdaq 100 losing -51.9% (-51.5% including dividends) in that decline. The loss wiped out the entire total return of the S&P 500, in excess of Treasury bills, all the way back to June 1995. The chart below shows the ratio of nonfinancial market capitalization to corporate gross value-added, including estimated foreign revenues, on an inverted log scale (left, blue), along with the actual S&P 500 nominal annual total return over the subsequent 12-year period (right, red). Notice the spikes in prospective returns that accompanied the 2002 and 2009 market lows. Spikes in expected future market returns mirror the periodic retreats in market valuation that have occurred regularly across history. During periods of very low interest rates, these spikes have sometimes ended in a valuation range consistent with 8-10% prospective 12-year market returns. In some instances, particularly following the soaring inflation of the late-1970’s, valuations collapsed to much deeper levels, with prospective future market returns spiking into a far higher range near 15-20%. Compare those periods with the depressed prospective returns implied by valuations at the 2000, 2007 and present market extremes.
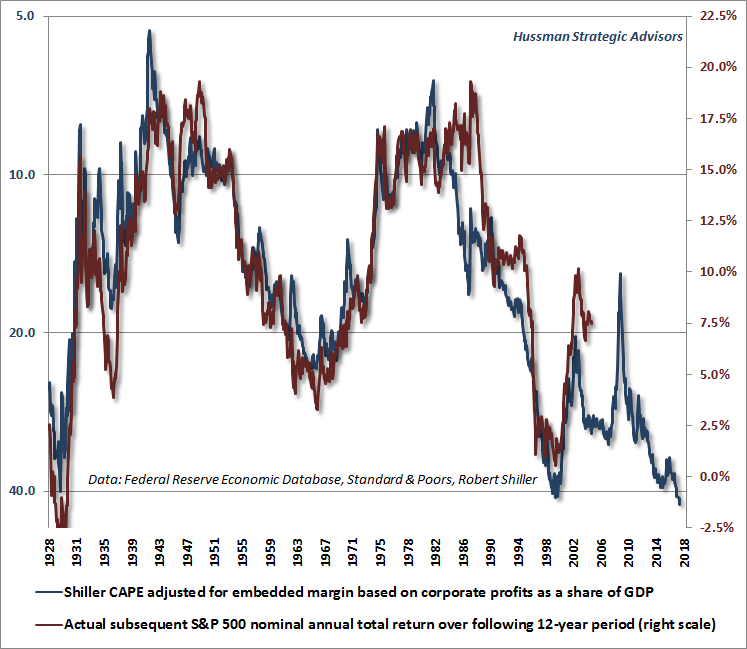
It’s easy to forget that while the 2009 low took the most historically reliable market valuation measures only to moderately undervalued levels, particularly compared with secular undervaluation extremes like 1942 and 1982, that decline still left the S&P 500 -49.2% below the high it set nine years earlier during the tech bubble (-47.4% including dividends), while the Nasdaq 100 remained -77.8% below that high (-77.2% including dividends). There’s no evidence that the mapping between historically reliable valuation measures and subsequent 10-12 year market returns has deteriorated at all in recent cycles. While the relationship isn’t perfect, it’s not surprising that at points of historically obscene valuations like 2000 (and today), market returns over the preceding 10-12 year period have been higher than investors would have expected 10-12 years earlier based on prevailing valuations at the start of those periods. That, of course, is precisely because the end-of-period valuations were temporarily and abnormally extreme. Nobody in their right mind would base their expectations for future market returns on the assumption that the market would stand at such extreme valuations at the end of the horizon. Remarkably, however, when valuations actually reach those obscene bubble extremes, investors seem to assume that the bubble valuations will persist indefinitely, and will never, ever, revisit their historical norms again. Presently, investors appear to have entirely ruled out market losses on the order of the -55.3% loss in the S&P 500 during the 2007-2009 collapse, and the -82.8% loss in the Nasdaq 100 during the 2000-2002 collapse. This is a mistake. It’s too easy to forget that by the low of the 2007-2009 collapse, the total return of the S&P 500 had lagged risk-free Treasury bills for nearly 14 years, all the way back to June 1995, and had outpaced Treasury bills by less than 1.2% annually over the nearly 22-year period since the 1987 high, even though early-2009 valuations reached only modestly undervalued levels based on the most historically reliable measures we identify. Having anticipated both the 2000-2002 and 2007-2009 collapses, with a constructive shift in-between, I remain convinced that investors are walking eyes-wide-shut into a similar outcome today. By the completion of the current market cycle, I expect that the S&P 500 will have lagged Treasury bills for the entire period since roughly October 1997. Even though the S&P 500 had done quite well over prior complete market cycles, the half-cycle loss it experienced in the 2007-2009 decline was enough to eat into the returns of prior market cycles. In the rear-view mirror, the difficult half-cycle loss made the S&P 500 appear to have been a mediocre investment for over two decades. In the face of such disappointment, it was tempting for buy-and-hold investors to abandon their discipline. Were the ones that held on fools? To the contrary, that low point was the moment that disciplined buy-and-hold investors most needed to stay the course. Whether a half-cycle takes the form of a bull market or a bear market, it’s often when investors become convinced that a half-cycle is permanent that the other half bursts out of the shadows. Moments like the present, when valuations are obscene, and past returns appear nearly too good to be true (because they most likely are), are actually the points where investors should think twice about their market exposure. Karma trains and roller coasters Our experience in the advancing half-cycle since 2009 was disappointing for a very specific reason. While our value-conscious, historically-informed discipline repeatedly navigated previous complete market cycles admirably, my 2009 insistence on stress-testing our methods against Depression-era data was an ill-timed fiduciary inclination. As employment losses and credit strains moved well outside of post-war experience, that stress-testing decision truncated my late-2008 constructive shift (after a market loss that we fully anticipated) which was otherwise similar to constructive or aggressive outlooks that I’ve encouraged after every bear market in over 30 years as a professional investor. In the interim of that “two data sets problem”, we missed a rebound that both our pre-2009 and our present methods could have captured, and inadvertently introduced a vulnerability to deranged central bank policies that have now produced one of the three most extreme points of market overvaluation in history. We’ve since adapted our discipline (specifically, extreme “overvalued, overbought, overbullish” syndromes that were effective in prior market cycles had to be explicitly prioritized behind market internals in a zero interest rate environment). The impact of those adaptations isn’t yet obvious, and in the interim, we’ve experienced an extended period of frustration. Still, let’s be blunt. It’s rather unreflective to deride my own inadvertent stumble in the half-cycle since 2009, while overlooking that the major market indices experienced even greater difficulties, albeit at different points in time, in recent market cycles. It’s similarly unreflective to smugly ignore current valuation extremes, when every market cycle in history (including those featuring similarly low interest rates) has drawn reliable valuation measures toward or below their historical norms, and when the completion of the current speculative episode would not even require a reversion to historically normal valuations to wipe out every bit of total return in the S&P 500 since 2000. It’s particularly bad form to deride my inadvertent narrative in the recent half-cycle while simultaneously biting the hook of exactly the same valuations that produced two of the worst market collapses in history, both which we fully anticipated. That particular karma train will come back around with 5,000 tons of freight. It’s worth remembering that it has taken one of the most extreme periods of speculation in U.S. financial history to bring the annual total return of the S&P 500 since March 2000 just 3.3% above the return that investors would have obtained from Treasury bills over the same period. My expectation is that all of that incremental return will vanish over the completion of the current cycle, and then some. In that event, the entire intervening roller-coaster ride will have been of no use at all to passive investors. Based on a century of market evidence, the landscape of the coming years is rather clear. Over the coming 12-year period, I expect that the S&P 500 will produce an overall total return of zero, with the S&P 500 Index most likely still below current levels in 2030, but with dividend income making up the shortfall. That expectation is remarkably robust to assumptions about interest rates. The reason is that when interest rates are low because growth is also low, no valuation premium is actually “justified” at all. Conversely, if despite all demographic and productivity trends, nominal growth was to somehow recover to its post-war norm of 6% (from a likely trend of less than half that rate), there will be strong pressure for interest rates to normalize as well; a combination that would also “justify” no valuation premium relative to historical norms. In my view, investors would best allow for a second-half to the current speculative market cycle. Specifically, even a temporary and rather pedestrian spike in prospective 12-year market returns no higher than the 8% area would still imply a market loss in the S&P 500 of about -48%, which is a smaller retreat than investors observed over the completion of the two most recent cycles. Remember, however, that the historical relationship between valuations and subsequent returns quietly embeds growth rates in U.S. GDP and corporate revenues that were much higher than we currently observe. Assuming a permanently low interest rate environment, based on the possibility that growth rates have also permanently slowed from historical norms, the expected return associated with a -48% market decline would also be commensurately lower than has historically been the case. That’s just an implication of discounted cash flows. It’s probably the point that our critics understand the least, because they seem to be making the quiet but devastatingly unlikely assumption that future interest rates will be permanently low, yet future growth rates will be historically normal. All factors considered, I actually view a market retreat of about -62% as most likely over the completion of the current market cycle, which probably seems as preposterous as the similar yet correct market losses I projected at the 2000 and 2007 market peaks. But then, I assume that the success of our historically-informed, value-conscious, full-cycle discipline in prior complete market cycles is part of the reason people read my stuff, despite my admitted stumble in the recent half-cycle. The next chart shows the close relationship between valuations and subsequent 12-year market returns going back to the 1920’s, though with a slightly less reliable measure (for additional charts and detail, including a discussion of the role of interest rates, see Valuations, Sufficient Statistics and Breathtaking Risks and The Conceit of Central Bankers and the Brief Illusion of Wealth). Compare the present extreme with all of market history. Aside from the 2007 and 2000 peaks in valuation (and troughs in prospective market returns), only one other similar point emerges, which corresponds to the 1929 market high.
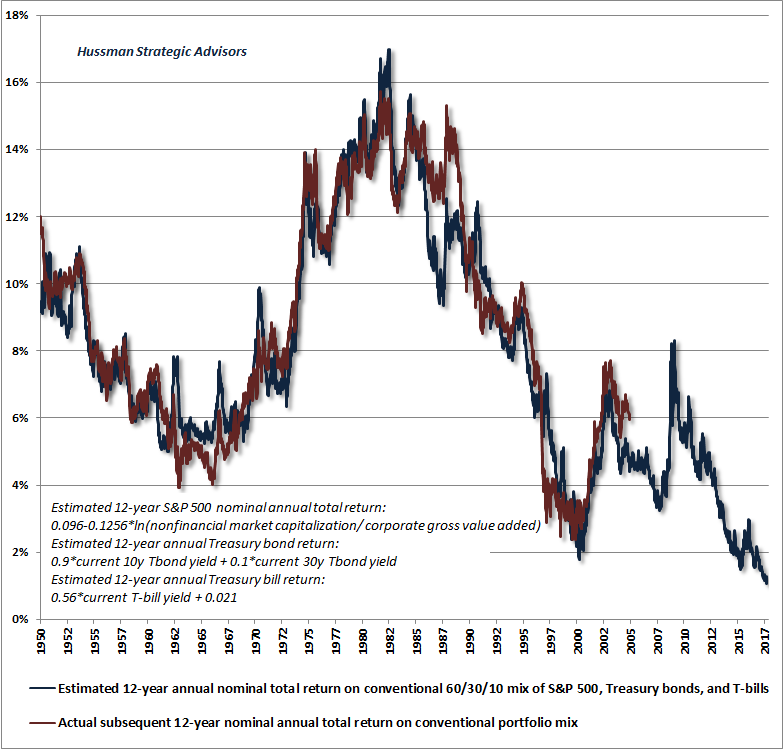
Despite extreme valuations, the concern we hear most often is that short-term interest rates are unacceptably low as an alternative to stocks. It’s essential to recognize that this is rear-view thinking, based on the notion that stocks somehow produce long-term returns independent of their level of valuation. The fact of the matter is that the deranged behavior of central banks has produced a world in which prospective returns on nearly all risky assets are likely to be similar or lower than the returns on safer alternatives in the coming years. The chart below, for example, presents our estimates of 12-year prospective returns on a conventional mix invested 60% in the S&P 500, 30% in Treasury bonds, and 10% in Treasury bills. As of last week, that prospective return estimate stands at the lowest level in history. Notably, with a zero return expected for the S&P 500 over this horizon, and just 2.3% built into the yield-to-maturity on Treasury bonds, the average 2.7% yield we expect on a rolling investment in Treasury bills over the coming 12-year period actually represents the highest return component of this mix. Obviously, those relative expected returns will change as stock and bond market valuations do. My impression is that investors taking a substantial position in cash, hedged-equity, and other alternative investments today will find opportunities to shift back toward unhedged investments in stocks and Treasury bonds as those prospective returns become more compelling. Such opportunities appear as upward spikes on the chart below.
With regard to shorter-term market dynamics, last week’s new highs have failed, as yet, to recruit meaningful uniformity across our measures of market internals. The current dispersion is observable even on the basis of fairly coarse measures. For example, with several major indices setting marginal new highs, 43% of all U.S. stocks remain below their respective 200-day moving averages. We wouldn’t be inclined to aggressively tighten defenses or raise safety-nets in the event of a further advance, but we’re also rather skeptical of recent market action, given continued internal dispersion and evidence of flagging sponsorship from a price-volume standpoint. Broader uniformity here would defer the immediacy of our downside concerns, though probably encouraging a neutral near-term outlook rather than a constructive one. As usual, we’ll take shorter-term evidence as it comes. For our part, the highest expected return/risk profiles we identify generally emerge when a material retreat in valuations is joined by an early improvement in our measures of market action. Unless the next market collapse somehow involves the need to incorporate data from the 1637 collapse of Dutch tulip prices, I’m confident that no need for stress-testing will truncate that opportunity, as it unfortunately did in 2009. As adamant as I remain about market risks today, I have every expectation that the opportunity to embrace a constructive or aggressive investment stance will emerge over the completion of the current market cycle, as it has over the completion of every market cycle in history.--- The foregoing comments represent the general investment analysis and economic views of the Advisor, and are provided solely for the purpose of information, instruction and discourse. Prospectuses for the Hussman Strategic Growth Fund, the Hussman Strategic Total Return Fund, the Hussman Strategic International Fund, and the Hussman Strategic Dividend Value Fund, as well as Fund reports and other information, are available by clicking "The Funds" menu button from any page of this website. |
|||||||||||||||||||||||||
|
For more information about investing in the Hussman Funds, please call us at
1-800-HUSSMAN (1-800-487-7626) 513-326-3551 outside the United States Site and site contents © copyright Hussman Funds. Brief quotations including attribution and a direct link to this site (www.hussmanfunds.com) are authorized. All other rights reserved and actively enforced. Extensive or unattributed reproduction of text or research findings are violations of copyright law. Site design by 1WebsiteDesigners. |